SimBrasil/ OTIMIZAGRO
SimBrasil/OTIMIZAGRO is a spatially-explicit model of land use change for the entire country of Brazil that responds to agricultural scenarios.
In this version, SimBrasil/OTIMIZAGRO was adapted to estimate CO2 emissions from deforestation in the major Brazil’s biomes under historical baselines and reduction targets according to the National Climate Change Plan.
Key words: Low carbon agriculture, National Climate Change Plan, agriculture expansion, Deforestation, CO2 emissions.
Access our paper on Brazil’s market for trading forest certificates.
Introduction
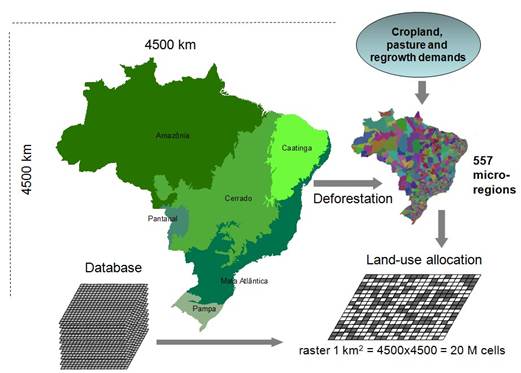
SimBrasil/OTIMIZAGRO is a nationwide, spatially-explicit model that simulates land use, land use change, forestry, deforestation, and regrowth under various scenarios of agricultural land demand and deforestation policies for Brazil, together with the resulting carbon emissions. SimBrasil/OTIMIZAGRO framework, developed on Dinamica EGO platform (Soares-Filho et al. 2009), is structured in three spatial levels: (i) Brazil’s biomes, (ii) IBGE micro-regions (557), (iii) and raster grid of 1km2 spatial resolution (Fig. 1). For each micro-region, the model spatially allocates land for a basket of crops − including sugar cane, soy, corn, cotton, beans and rice −, forest plantation, pasture, and regrowth as a function of crop aptitude and profitability calculated by using production and transportation costs. When available land in a given micro-region is insufficient for total specified agricultural land allocation, SimBrasil/OTIMIZAGRO first converts forest and savanna (cerrado) to agricultural land and then if additional land is still required, SimBrasil/OTIMIZAGRO reallocates the distribution of remaining croplands and pastures to neighboring regions, creating an overspill effect. Micro-regions’ land demands are exogenous to the model. In this version, land demand is projected by BLUM (Brazil Land Use Model) under two agricultural scenarios: a traditional agricultural expansion reference scenario and a low carbon agriculture implementation scenario (Gouvello et al. 2010). Additionally, SimBrazil/OTIMIZAGRO can also analyze other plausible pathways of crop expansion and land use change, provided that data on land use trajectory are available.
In its version 2, SimBrazil/OTIMIZAGRO was modified to incorporate the NCCP – National Climate Change Plan – (PNMC, 2009) goals in reducing CO2 emissions from deforestation in Brazil major biomes by 2020. Hence, in this version land demands for crops and pasture and forestry as well as for forest restoration needed to comply with the forest code are forced to cope with specific trajectories of deforestation within the Amazon, Cerrado and Mata Atlantica biomes, which come either from a baseline or reduction target scenario. In this way, the main processing sequences in SimBrasil/OTIMIZAGRO are: (i) calculation of micro-region deforestation rates based on baseline or reduction scenarios per biome (ii) simulation of land-use change, (iii) estimation of resulting carbon emissions, and (iv) calculation of land use opportunity costs from reduced deforestation (still underway). All SimBrasil/OTIMIZAGRO outputs can be aggregated by various administrative boundaries from municipalities, states to the entire country, providing thus support for national and state land-use planning processes, such as Brazil’s REDD national-level and state programs.
Therefore, SimBrazil/OTIMIZAGRO is designed to help evaluate the impacts of environmental and agricultural policy scenarios that include, for example, the modification of Brazil’s forest code as well as strategies aimed to reconcile the goal of achieving NCCP targets while accommodating agricultural expansion needed to meet current and future world demand for agricultural products or in the context of investments that are being made under the GAP – Growth Acceleration Plan – (www.brasil.gov.br/pac).
Input Dataset
Methods
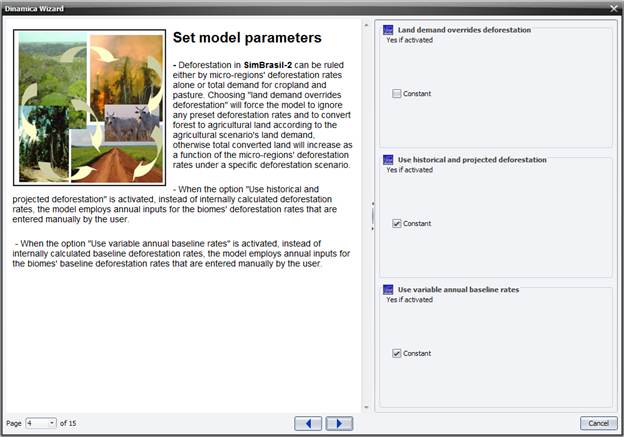
SimBrasil/OTIMIZAGRO model built on Dinamica EGO graphical interface comes with a wizard tutorial that enables the model to be easily customized by any end-user by clicking on the right panel buttons as the wizard moves forward (Fig. 5). In this way, SimBrasil/OTIMIZAGRO is preset to run from 2006 to 2030, but can be run for any time-period subset within this period by changing simulation initial and final years.
The main processing sequences in SimBrasil/OTIMIZAGRO are: (i) calculation of micro-region deforestation rates based on baseline or reduction scenarios per biome (ii) simulation of land-use change, (iii) estimation of resulting carbon emissions, and (iv) calculation of land use opportunity costs from reduced deforestation (still underway).
Deforestation in SimBrasil/OTIMIZAGRO can be ruled either by micro-regions’ deforestation rates alone or total demand for cropland and pasture. Choosing land demand overrides deforestation will force the model to ignore any preset deforestation rates and to convert forest to agricultural land according to the agricultural scenario’s land demand, otherwise total converted land will increase as a function of the micro-regions’ deforestation rates under a specific deforestation scenario. Also, when the option “Use historical and projected deforestation” is activated, instead of internally calculated deforestation rates, the model employs annual inputs for the biomes’ deforestation rates that are entered manually by the user. The same applies for the option “Use variable baseline” which makes the model use annual inputs for the biomes’ baseline deforestation rates instead of a fixed input. In this way, SimBrasil/OTIMIZAGRO enables the definition of a wide-range of baseline and target reduction trajectories.
Simulation of land-use changes is driven by the micro-region land use change rates and the spatial allocation process is based on the spatial transition probability maps that integrate the effects of a series of spatial determinants on deforestation as well as on crop suitability and rents.
Committed carbon emissions from deforestation in SimBrazil/OTIMIZAGRO is calculated by superimposing simulated deforested cells on the map of forest biomass, and assuming that carbon content is 50% of wood biomass (Houghton et al. 2001) and that 85% of the carbon contained in trees is released to the atmosphere through deforestation (Houghton et al. 2000).
Results
SimBrasil/OTIMIZAGRO main outputs consists of annual land-use maps for Brazil under a specific scenarios plus a series of tables with the land use area classes and biomes’ total deforestation rates and associated carbon emissions per year. In addition to total values for Brazil, these variables are also disaggregated per states (e.g. Figs. 6 and 7).


Next Steps
SimBrasil/OTIMIZAGRO is now being converted to OTIMIZAGRO, a partnership with SAE (SECRETARIA DE ASSUNTOS ESTRATÉGICOS DA PRESIDÊNCIA DA REPÚBLICA – SAE/PR), to become the main land-use planning at NIT (Núcleo de Inteligência Territorial) of MAPA (Ministry of Agriculture).
References
Bowman, M., Soares-Filho, B.S. Merry, F. Nepstad, D, Rodrigues, H., Almeida, O. Land Use Policy. Persistence of cattle ranching in the Brazilian Amazon: a spatial analysis of the rationale for beef production. 29, 558-568. 2012.
Fearnside, et al. Biomass and greenhouse-gas emissions from land-use change in Brazil’s Amazonian “arc of deforestation”: The states of Mato Grosso and Rondônia. In: Forest Ecology and Management. 258 (2009) 1968-1978.
Gouvello, C, Soares-Filho, B., Nassar, A., Schaeffer, R, Jorge, F., Nogueira, W. Brazil Low-carbon Country Case Study, 2010. WorldBank Report. 2010.
Hissa, L.B.V.; Soares-Filho, B.S.; Rodrigues, H.O. Modelagem da produtividade do cultivo de cana-de-açúcar (Saccharum spp) para o Brasil e Região MAP utilizando o Modelo SIMCANA. Revista Brasileira de Meteorologia (in review).
Houghton, R.A., D.L. Skole, C.A. Nobre, J.L. Hackler, K.T. Lawrence, W.H. Chomentowski. 2000. Annual fluxes of carbon from deforestation and regrowth in the Brazilian Amazon. Nature, 403, 301–304.
Houghton RA, Lawrence KT, Hackler J, Brown LS (2001) The spatial distribution of forest biomass in the Brazilian Amazon: a comparison of estimates. Global Change Biology 7:731-746.
IBGE (Instituto Brasileiro de Geografia e Estatística). 2000. Censo Demográfico de 2000.
IBGE. Mapa de Vegetação Original do Brasil. 2004.
Instituto Nacional de Pesquisas Espaciais (2011) PRODES: Assessment of Deforestation in Brazilian Amazonia. Accessed 01 February, 2011.
Ministério de Ciência e Tecnologia – MCT. Primeiro inventário brasileiro de emissões antrópicas de GEE: emissões e remoções de dióxido de carbono por conversão de florestas e abandono de terras cultivadas. Brasília, 2004.
Ministério do Meio Ambiente – MMA. Projeto de Conservação e Utilização Sustentável da Diversidade Biológica (PROBIO),2011
MMA. PROJETO RADAMBRASIL (1973-1983). Levantamento de Recursos Naturais. V.1 a 31.
Nogueira, et al. Estimates of forest biomass in the Brazilian Amazon: New allometric equations and adjustments to biomass from Wood-volume inventories. Forest Ecology and Management. 256 (2008) 1853-1867.
PNMC – Plano Nacional de Mudanças sobre o Clima (versão para consulta pública). Disponível em: <https://www.forumclima.org.br>. Último acesso em 13/05/2009.
Soares-Filho, B S., Rodrigues, H., Costa, W. Modeling Environmental Dynamics with Dinamica EGO. Available atwww.csr.ufmg.br/dinamica. 2009. ISBN: 978-85-910119-0-2, 120p.
SOS Mata Atlântica. 2011. Atlas dos municípios da Mata Atlântica.
Vera-Diaz M, Kaufmann R, Nepstad D, Schlesinger P (2008) An interdisciplinary model of soybean yield in the Amazon Basin: the climatic, edaphic, and economic determinants. Ecological Economics 3:420-431.