
We have developed a model to simulate deforestation across the Amazon Basin that incorporates major road paving investments within contrasting scenarios. Its architecture embodies coupled models structured in two spatial levels: 1) subregions defined from socioeconomic stratification and 2) raster cells. An upper model projects deforestation rates for the subregions, based on data provided mainly by PRODES, and passes them to a spatially explicit simulation model. Each subregion has a unique spatial model with customized parameters.
In this scenario, the paving follows a predefined schedule and its effect on deforestation is empirically estimated using PRODES data analyzed at municipality level.The other scenario also considers the current deforestation trends, but now its projection assumes an asymptotic logistic curve. In this so called “governance scenario”, it is imposed a 50% limit for deforested land within each basin’s subregion and existing and proposed protected areas play a decisive role in hindering deforestation as well.
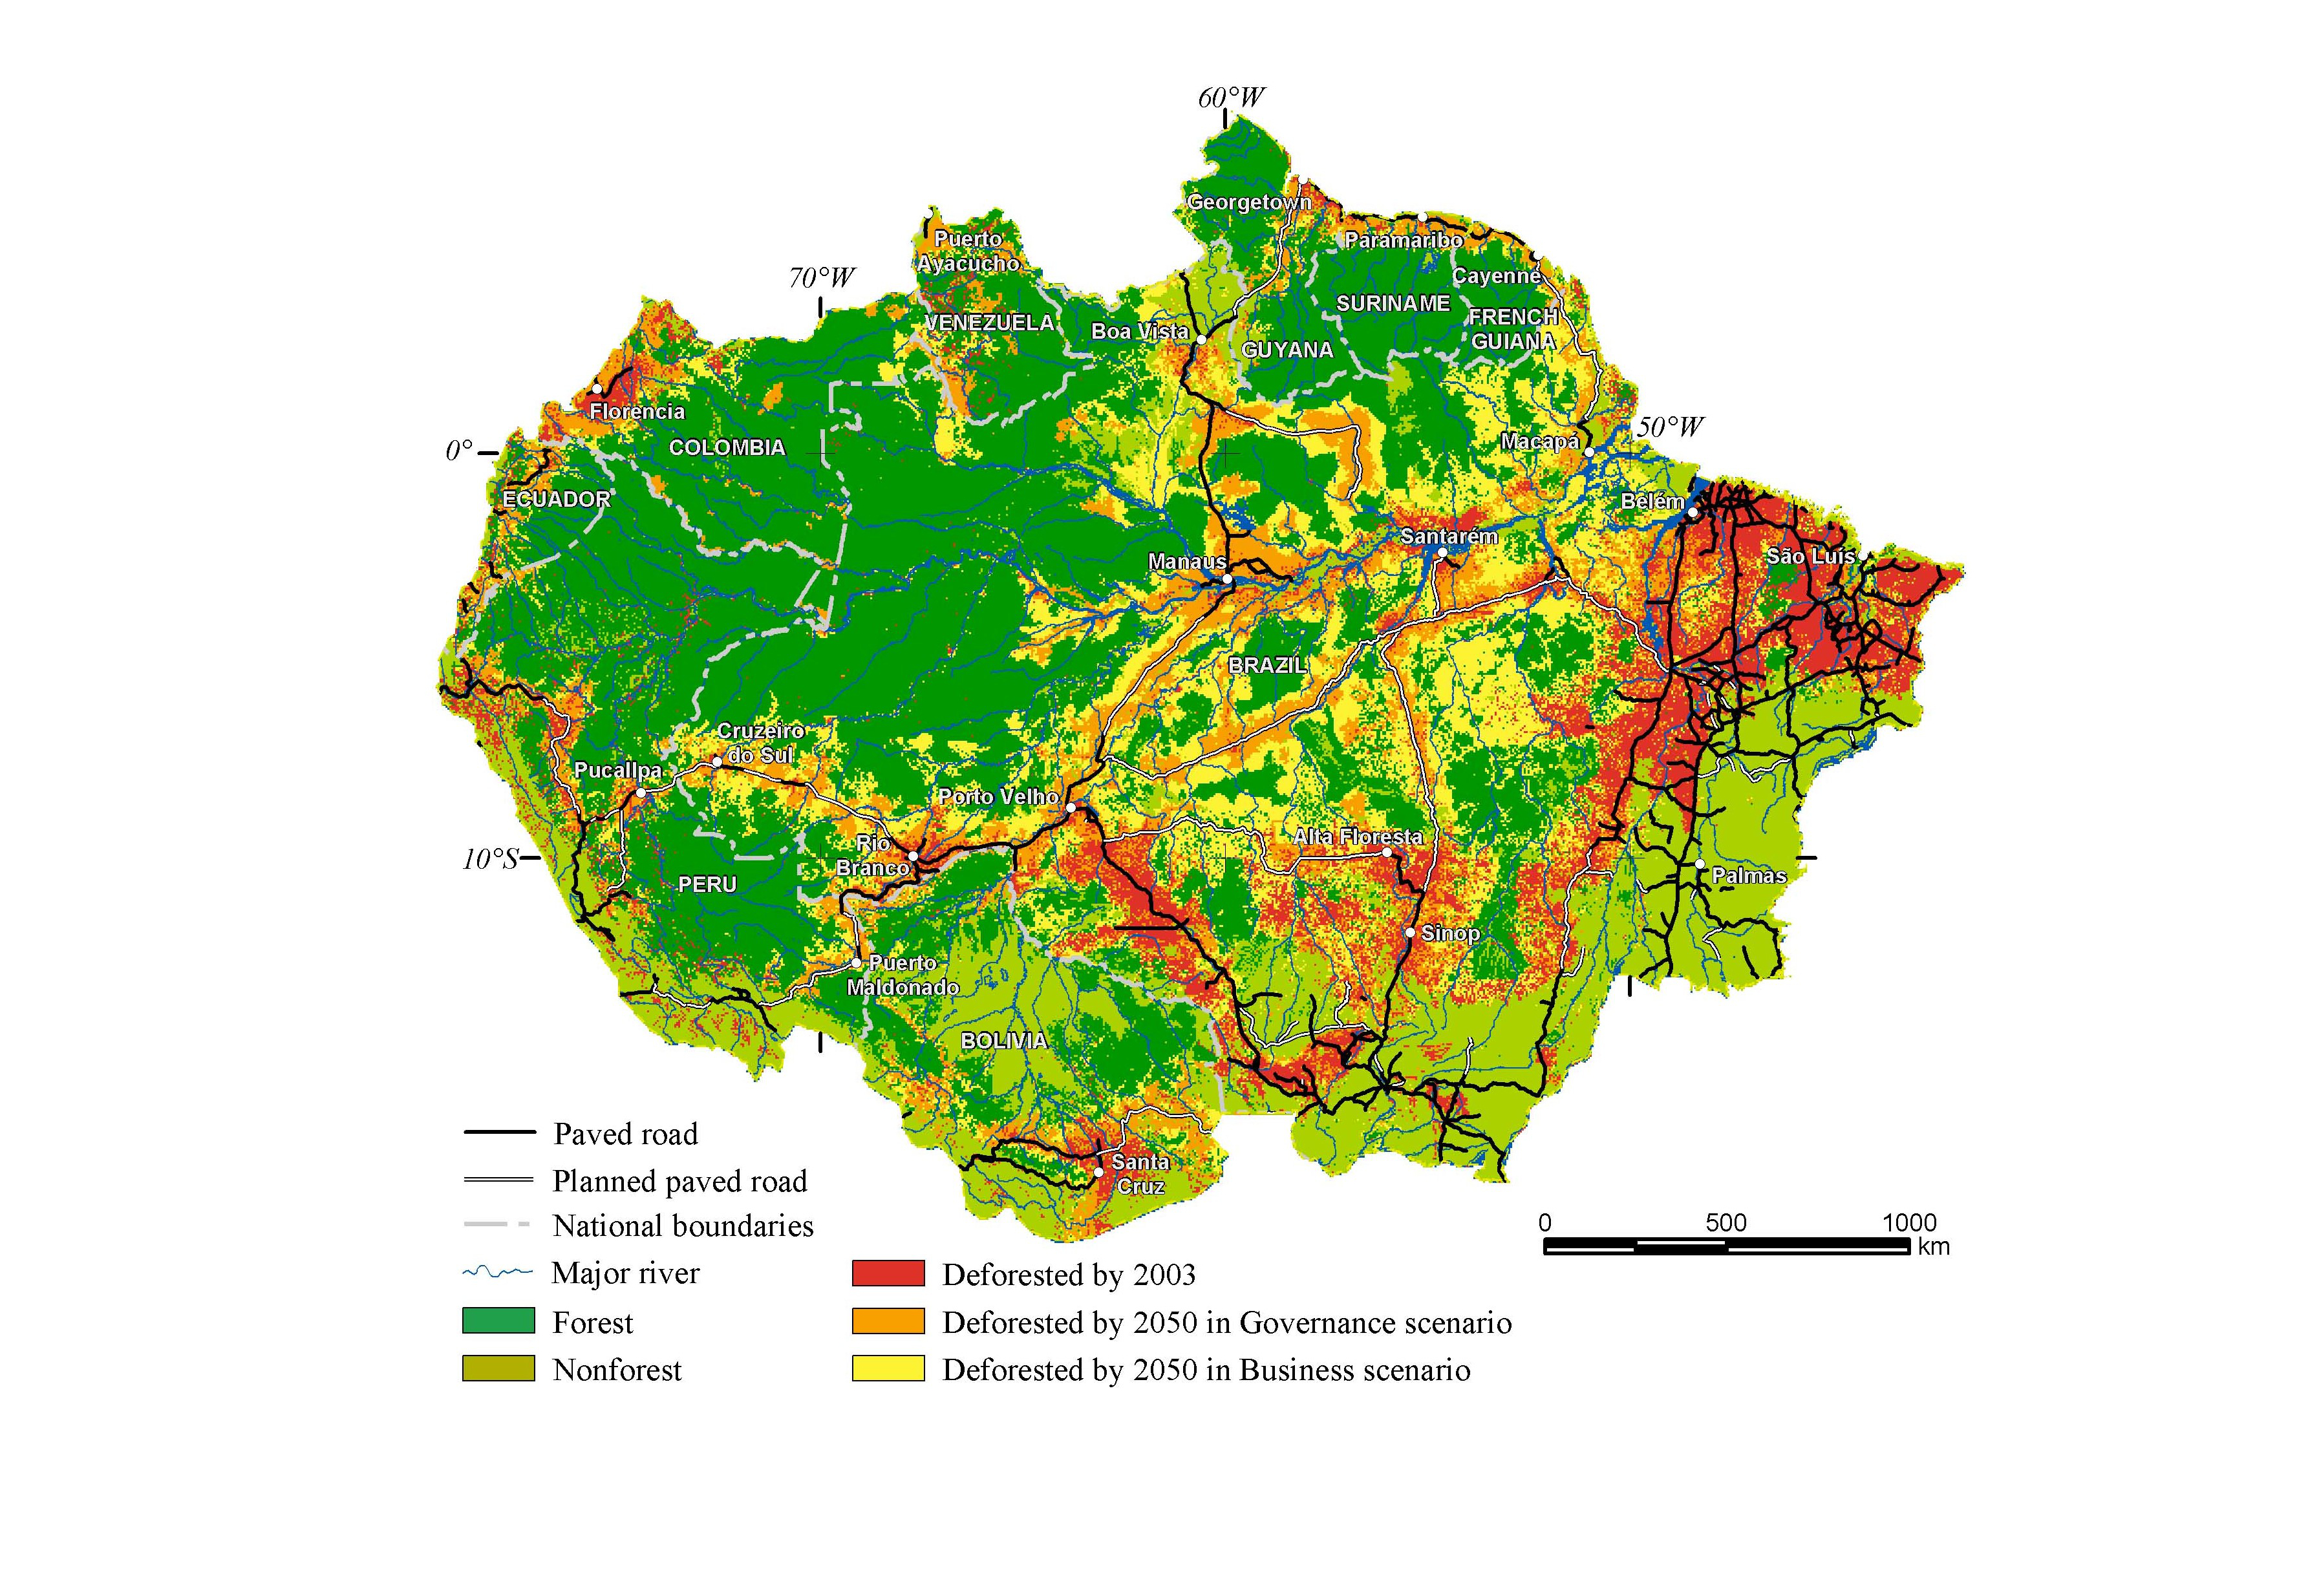
Cartographic algebra and cellular automata technique are used in order to develop the spatially explicit simulation that comprises a map of 3144×4238 cells at a 1 km2 resolution. The model employs cartographic data on infrastructure, administrative units, and biophysical settings and was spatially calibrated for 12 case study regions in the Brazilian Amazon. We ran the model for two scenarios.The “business-as-usual” scenario considers the deforestation trends across the basin, projecting the rates by using historical figures and their variations from 1997 to 2002, and adding to them the effect of paving a set of major roads.
Both simulations encompass 50 annual time steps starting at 2001. Results for the business-as-usual scenario show 23% and 37% of total forest decline within 30 years and 50 years, respectively. The expected deforestation is reduced up to 55% in the governance scenario. The simulated patterns of deforestation can be employed to assess future environmental impacts, such as habitat fragmentation, biodiversity loss, and hydrologic cycle alteration, to produce base lines of carbon emission, and used as inputs for Global Climate Models.
SimAmazonia
Simulation deforestation across the Amazon Basin
Input Data For The Subregions
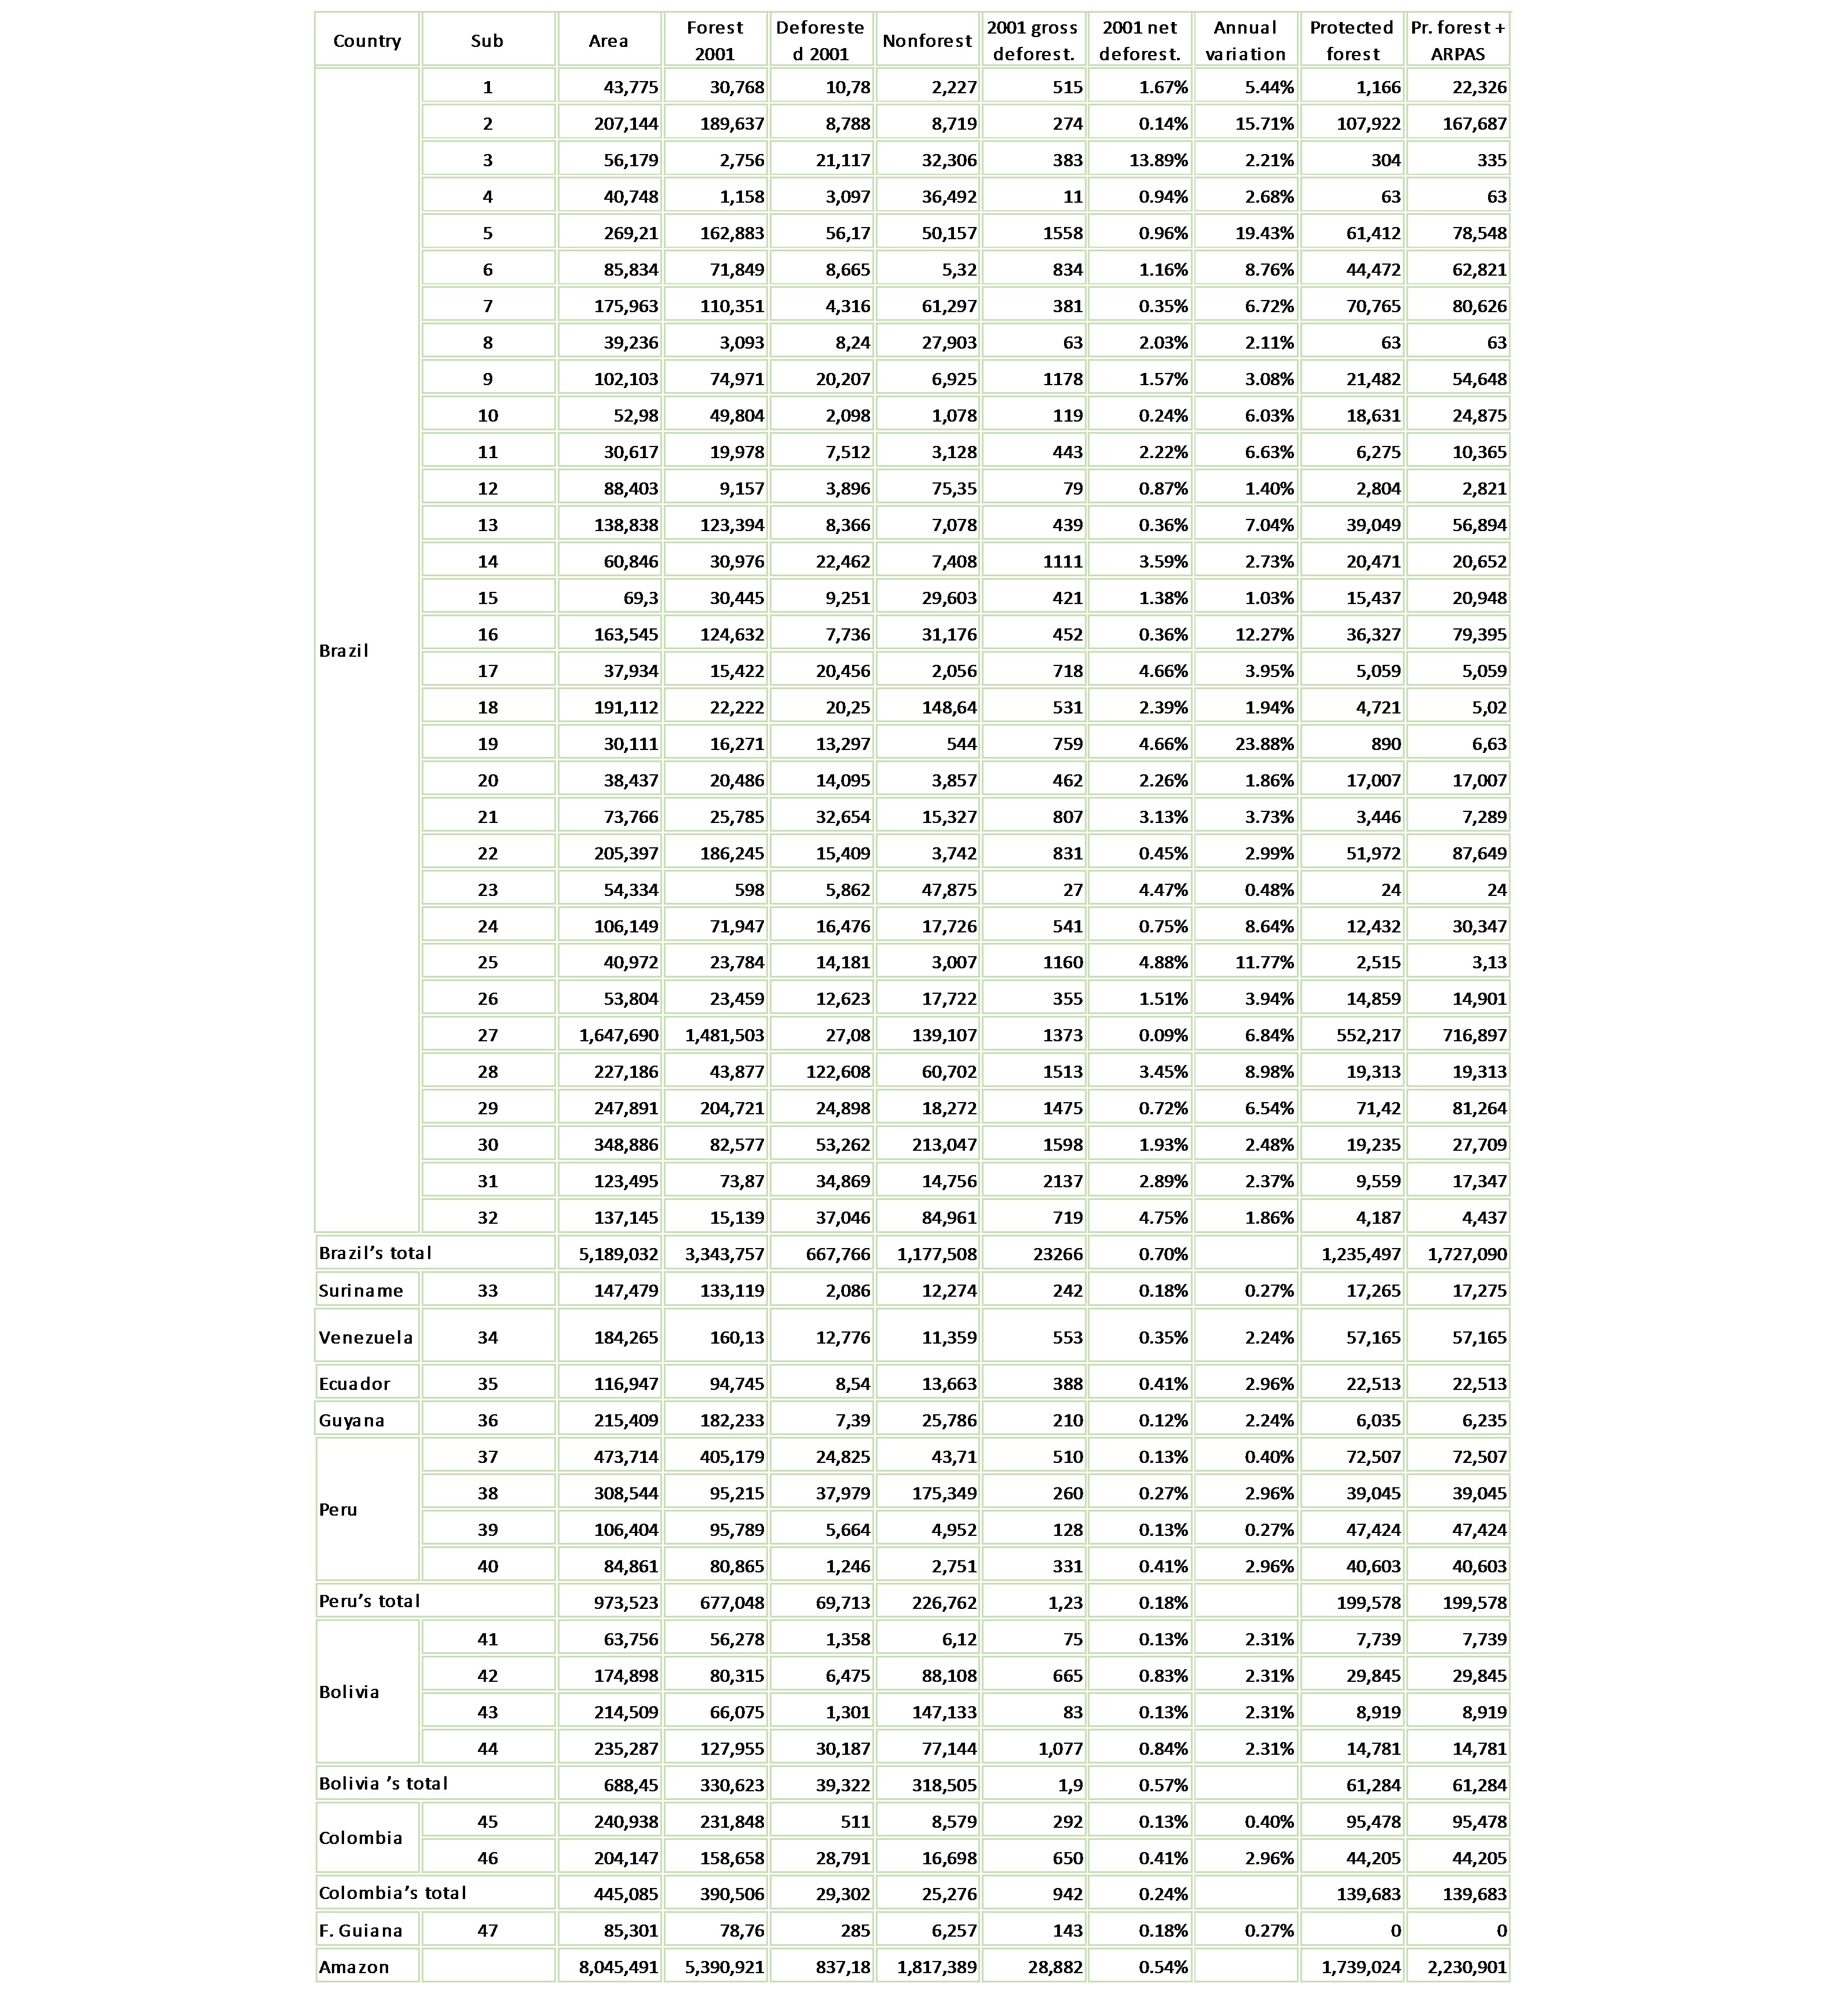
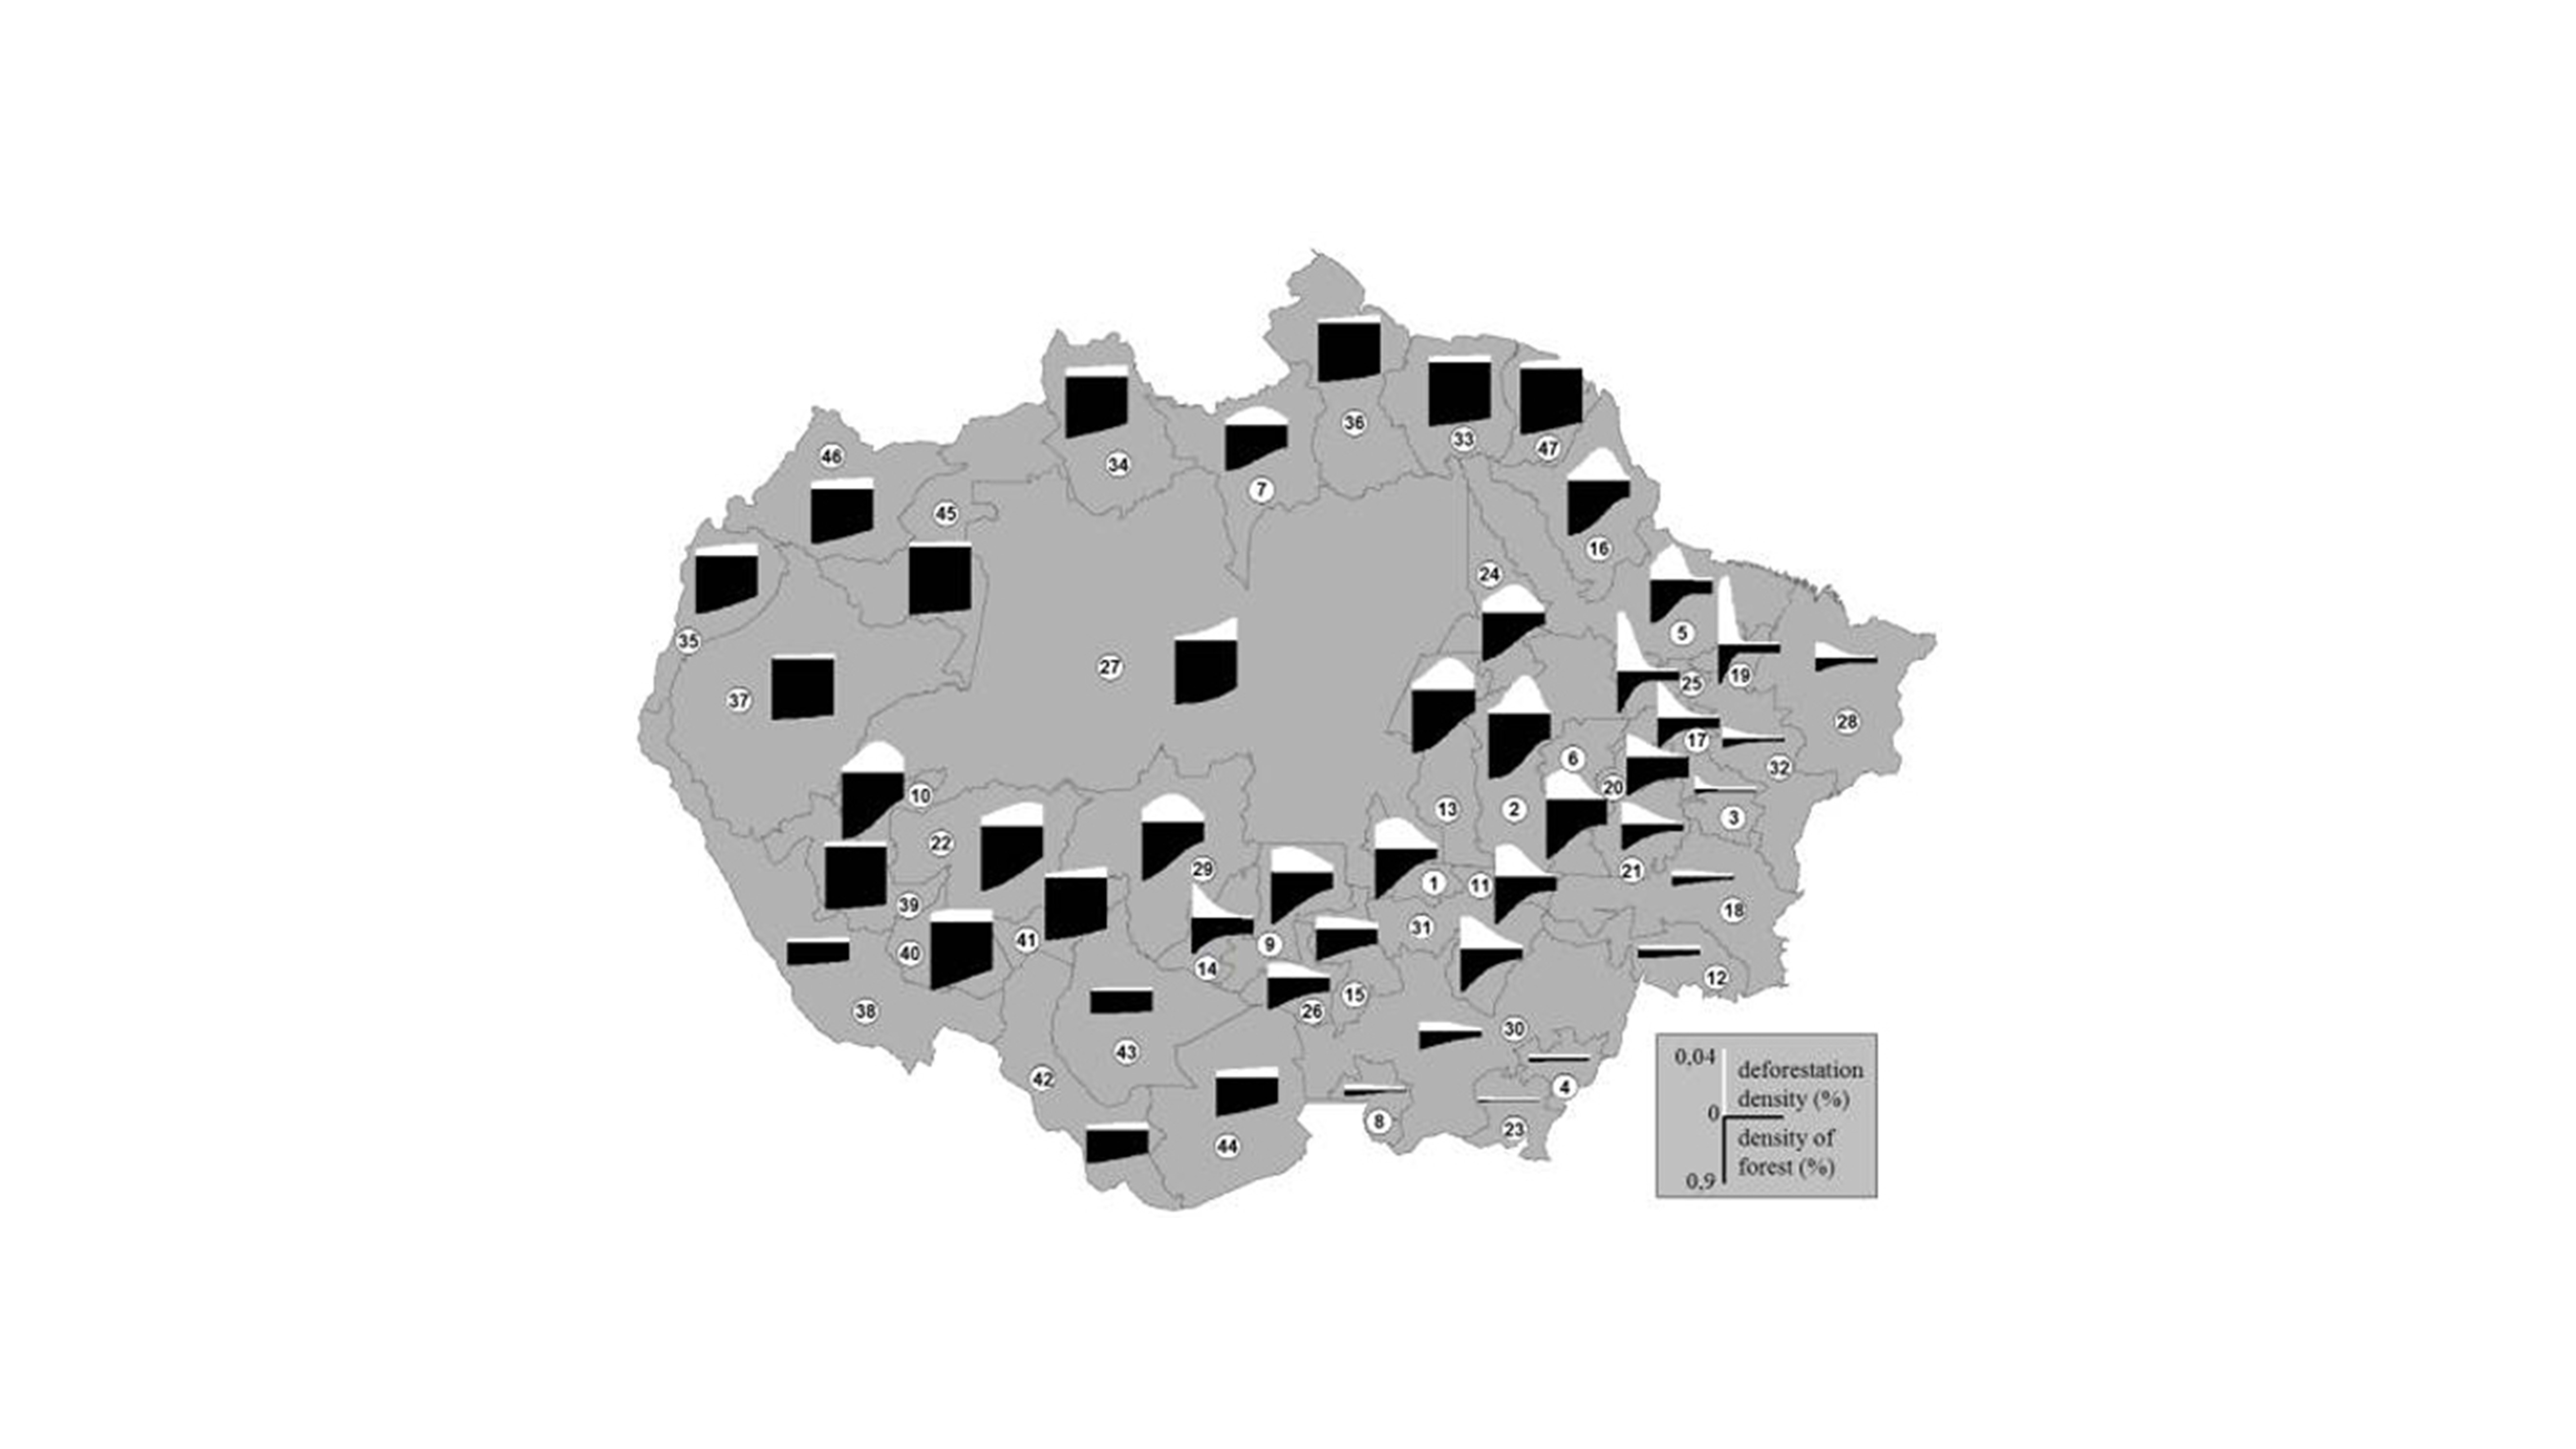
Stratification of the Amazon Basin depicting annual deforestation and forest decline from 2001 to 2050 forecast for the subregions under the business-as-usual scenario, with numbers keyed to their data in the paving schedule.
Paved road versus deforestation
Ratio of deforested to forest, as a function of distance to paved roads, derived for the Amazon Basin using the land cover map of 2001 and incremental distance from current paved roads.
Road paving schedule
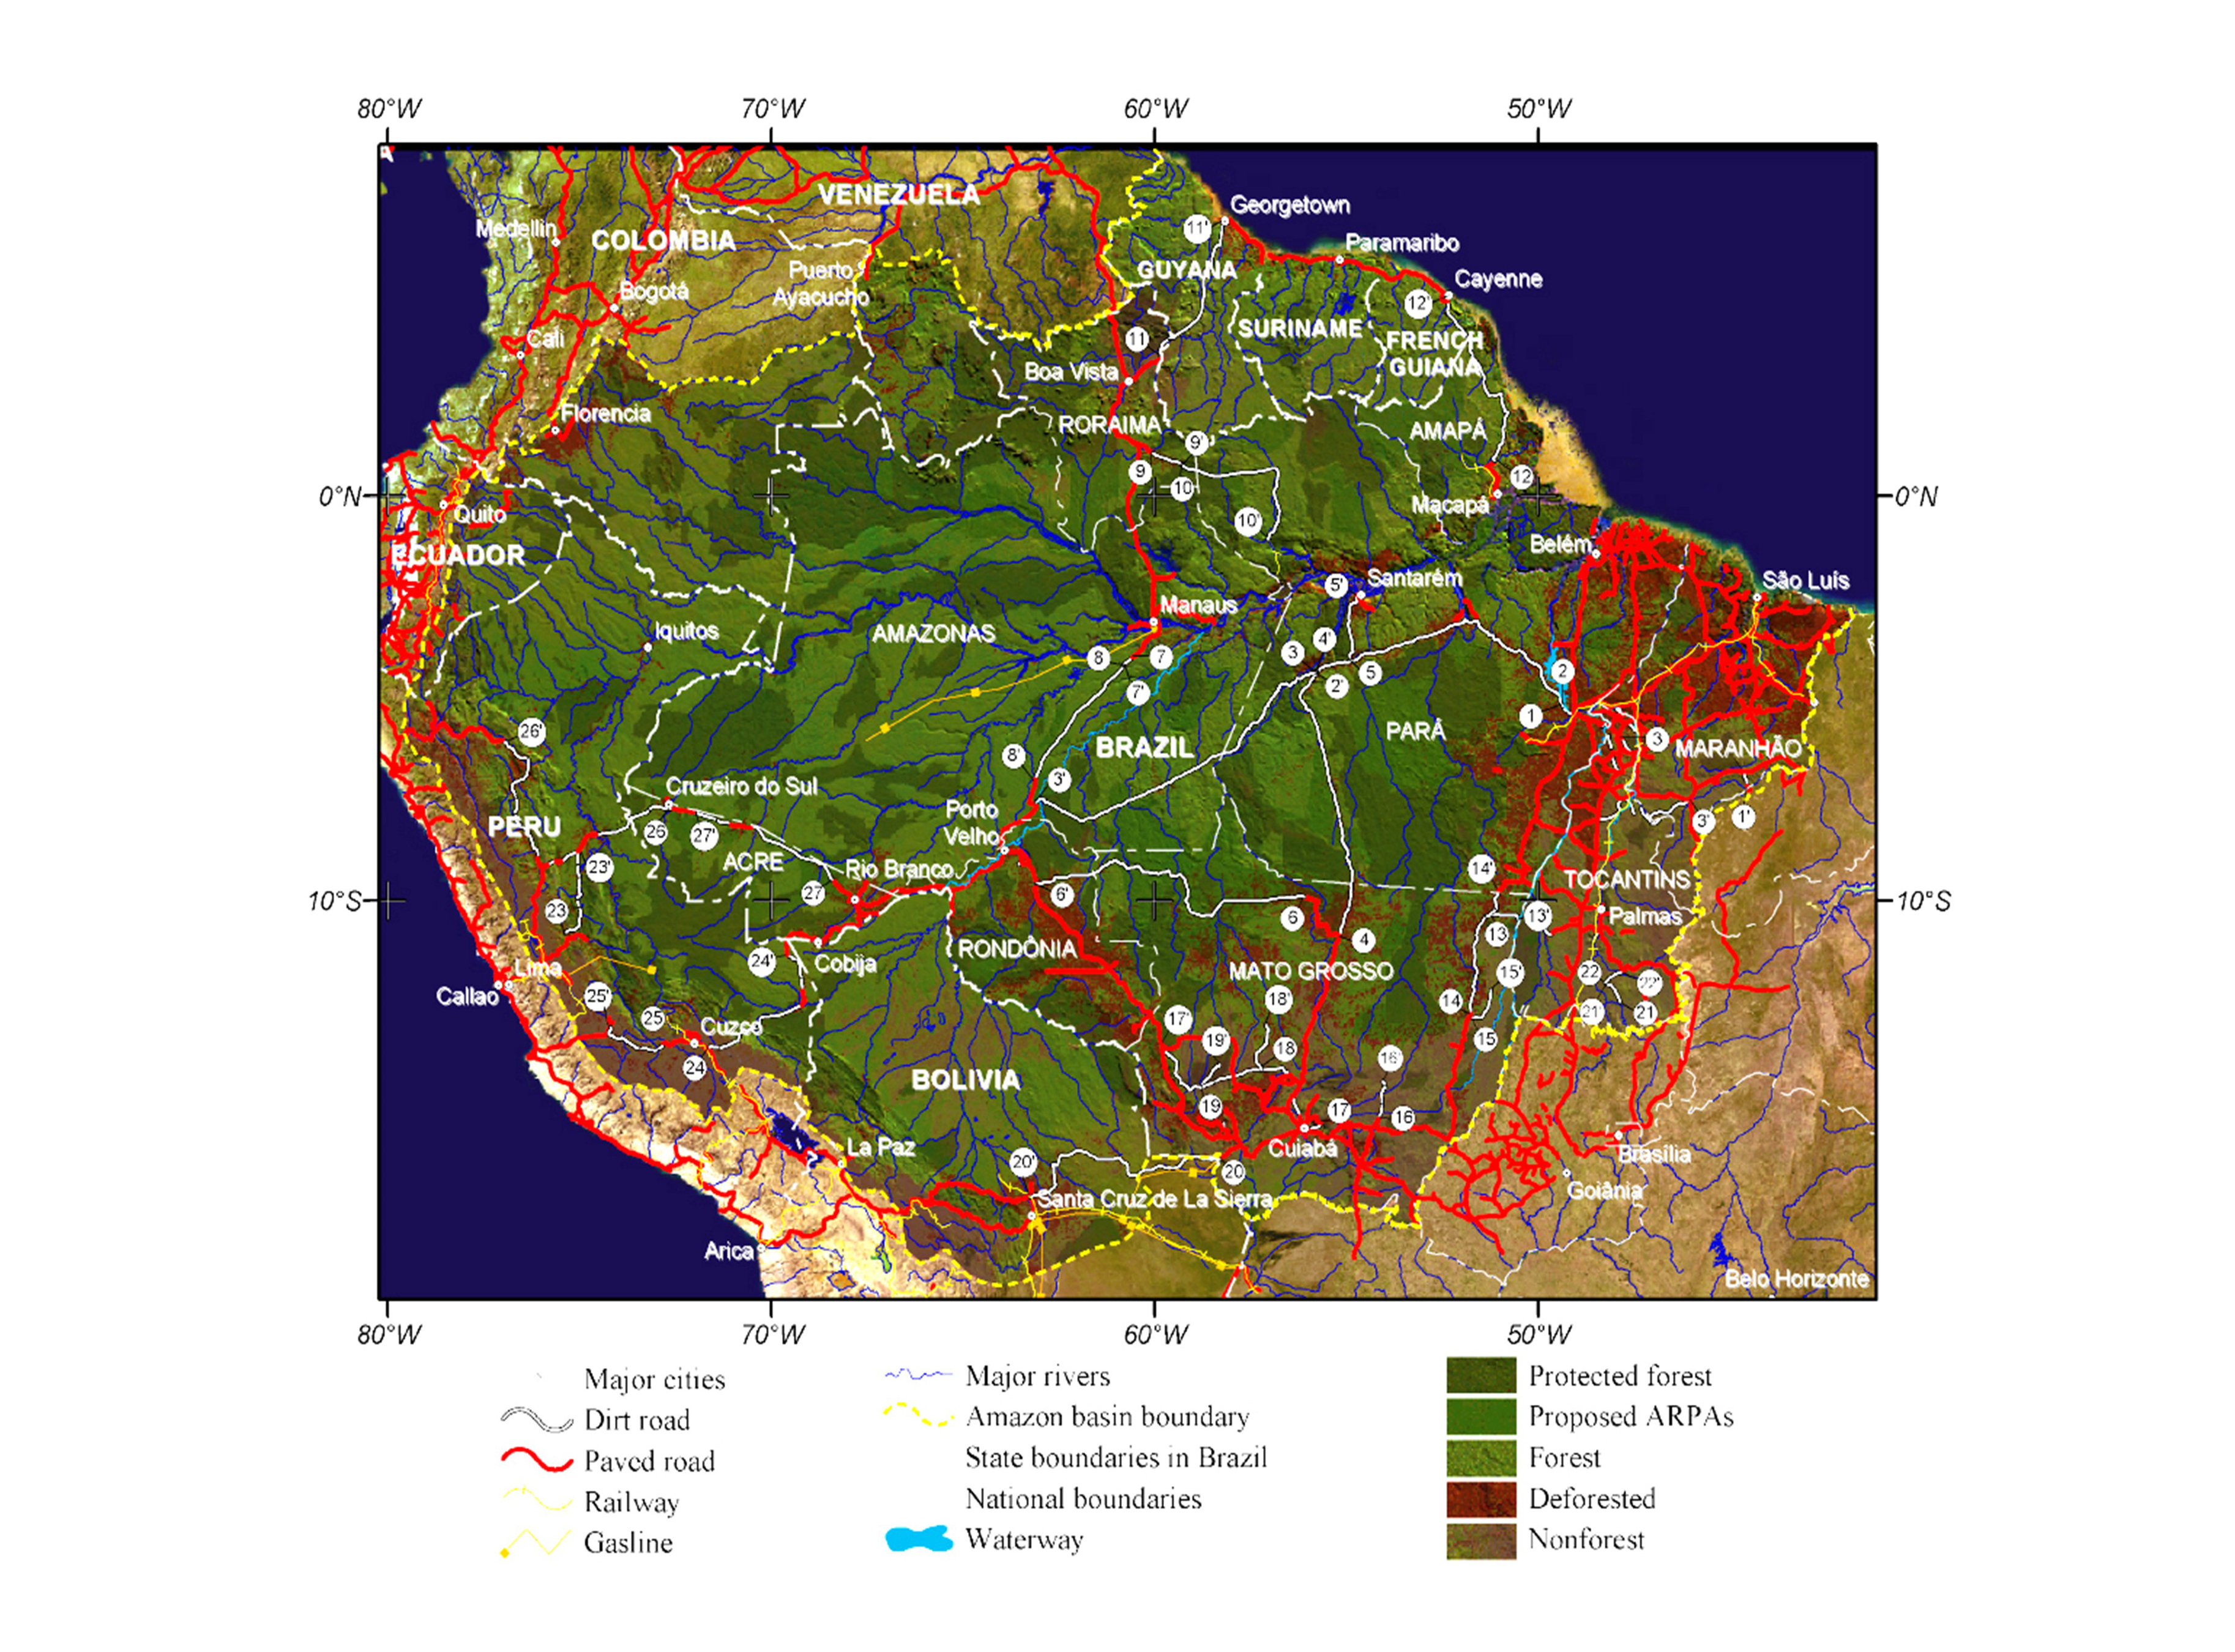
Road tracks planned to be paved are indicated by numbers keyed to the paving schedule table:

Acronyms for Brazilian States: To – Tocantins, PA – Pará, GO – Goiás, MT – Mato Grosso, RO – Rondônia, RR- Rorâmia, AP – Amapá, AC – Acre. Road paving phases comprise: 2001-2005, 2005-2012, 2012-2018, 2018-2025, 2025-2051. Town names are in italic.
Weights of evidence
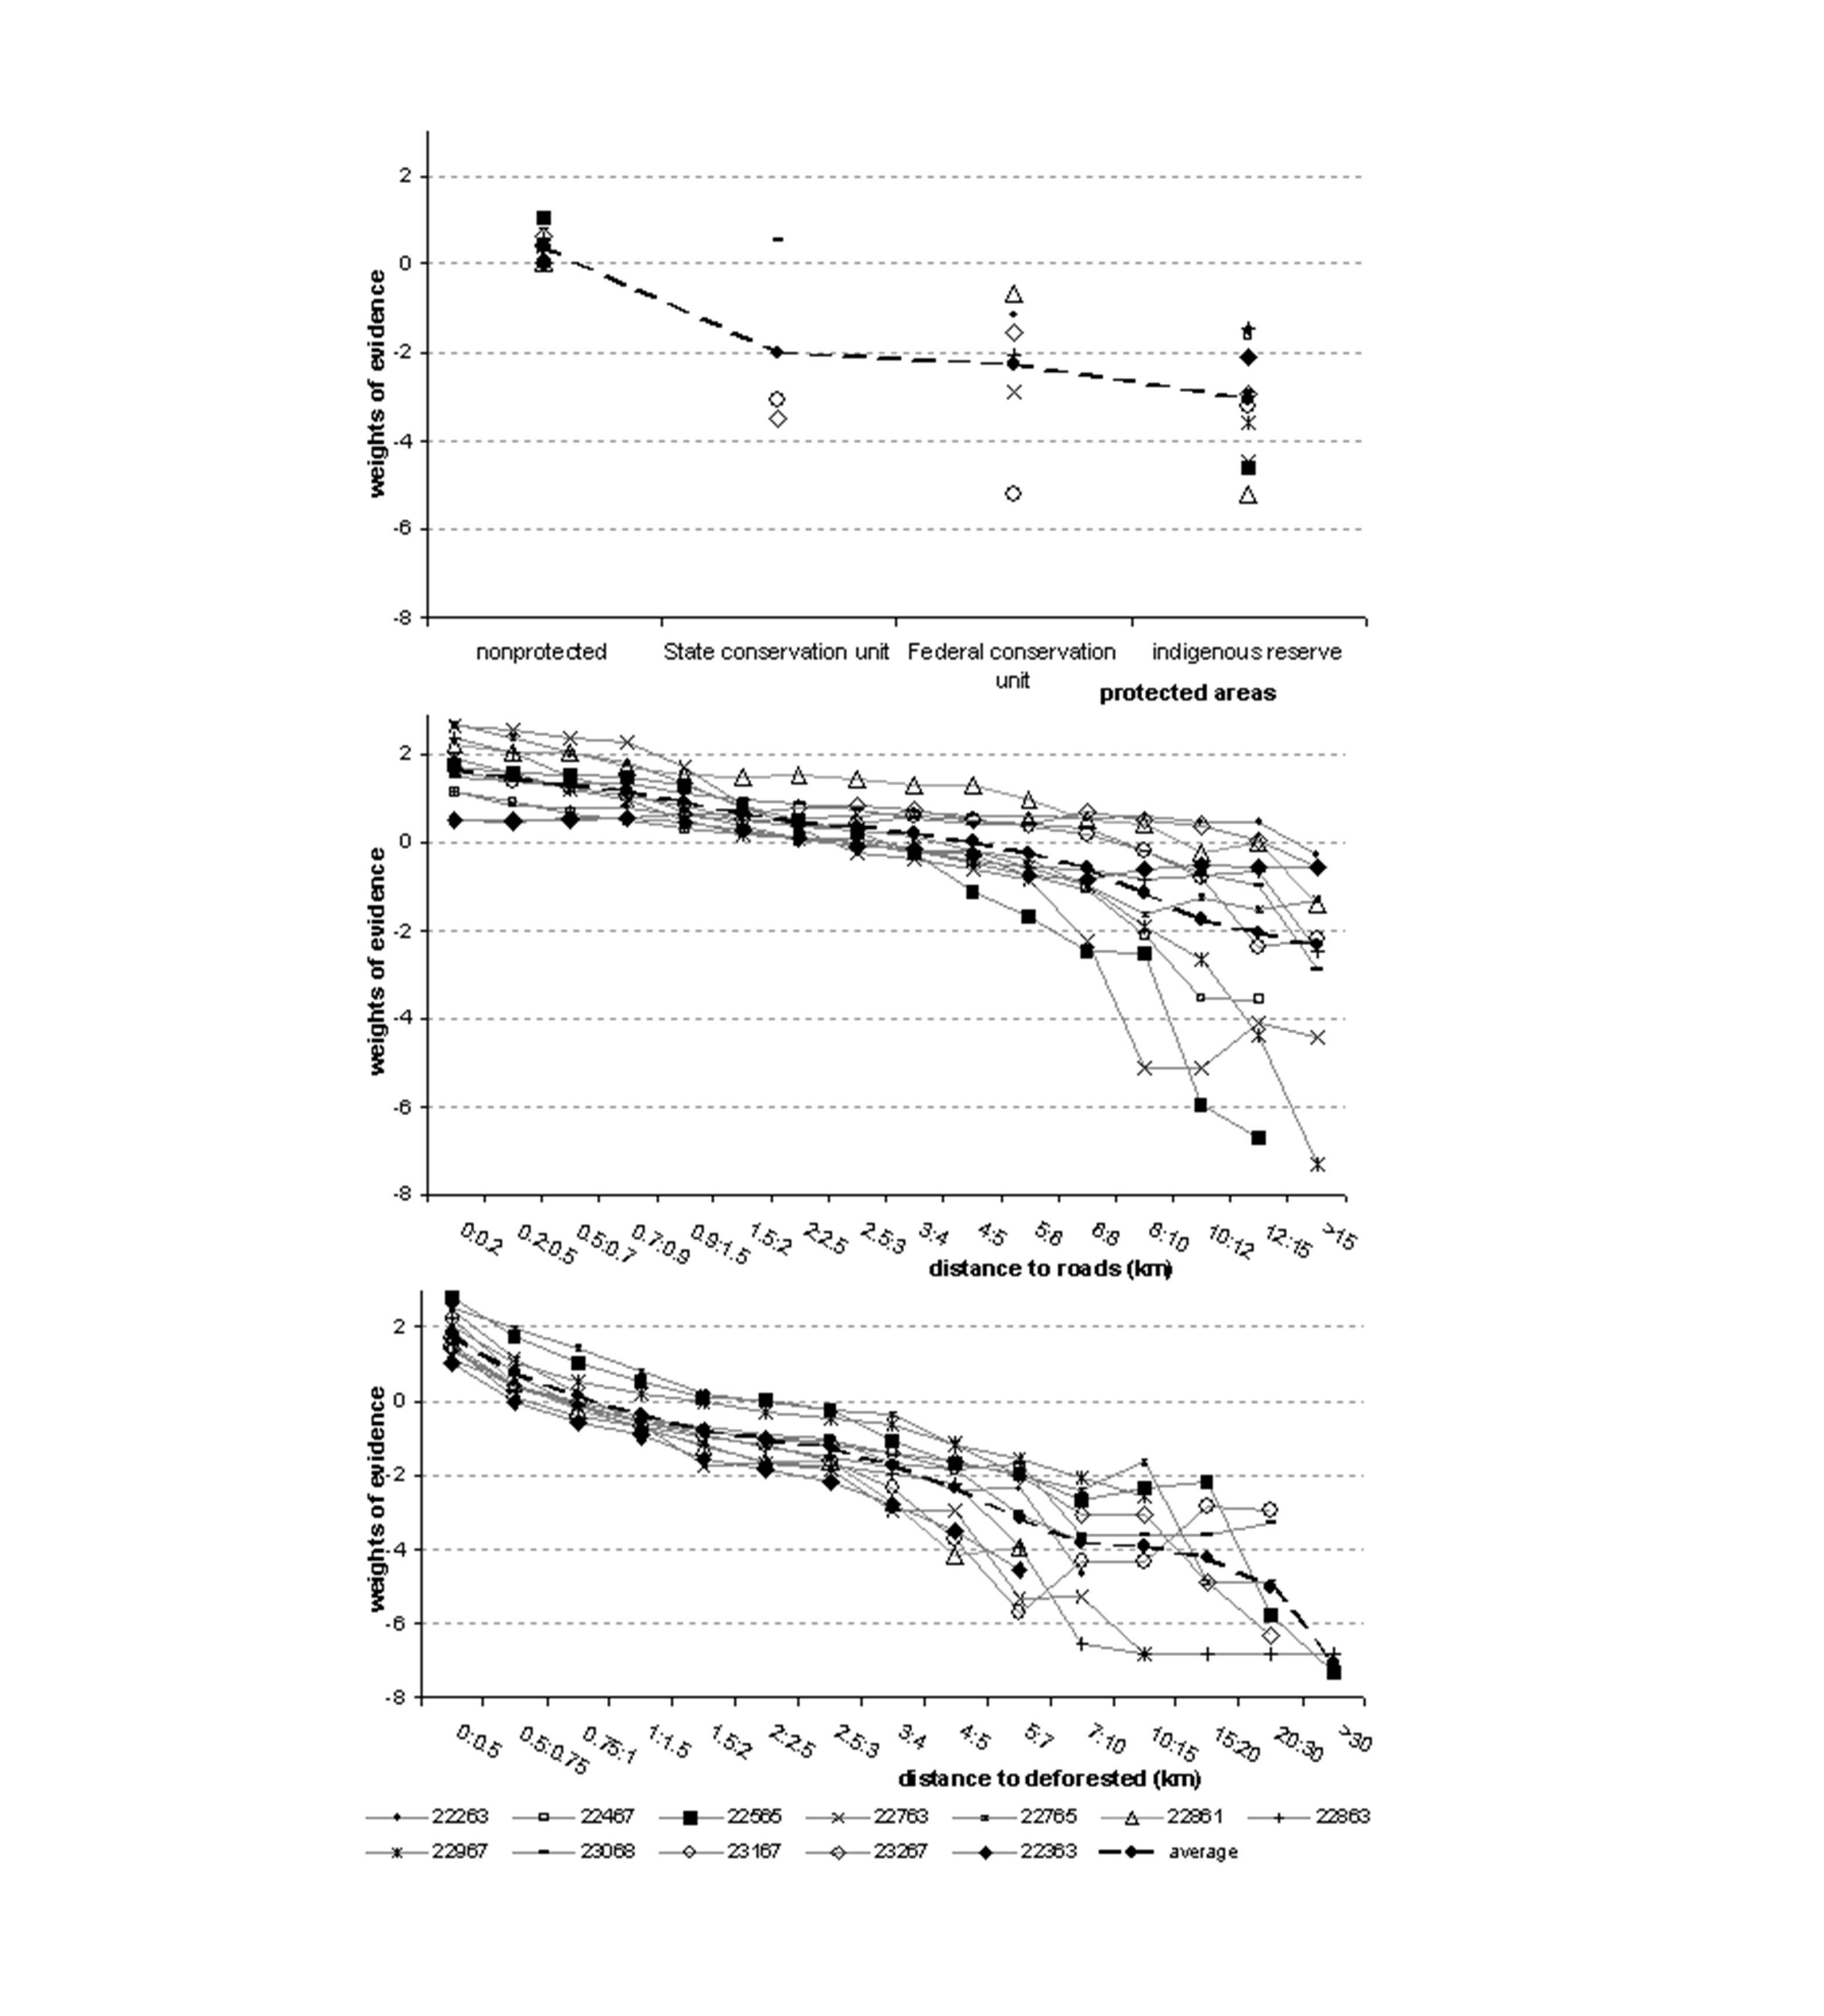
Weights of evidence derived for the case study areas. Numbers refer to orbit-points of Landsat scenes.
Spatial model architecture
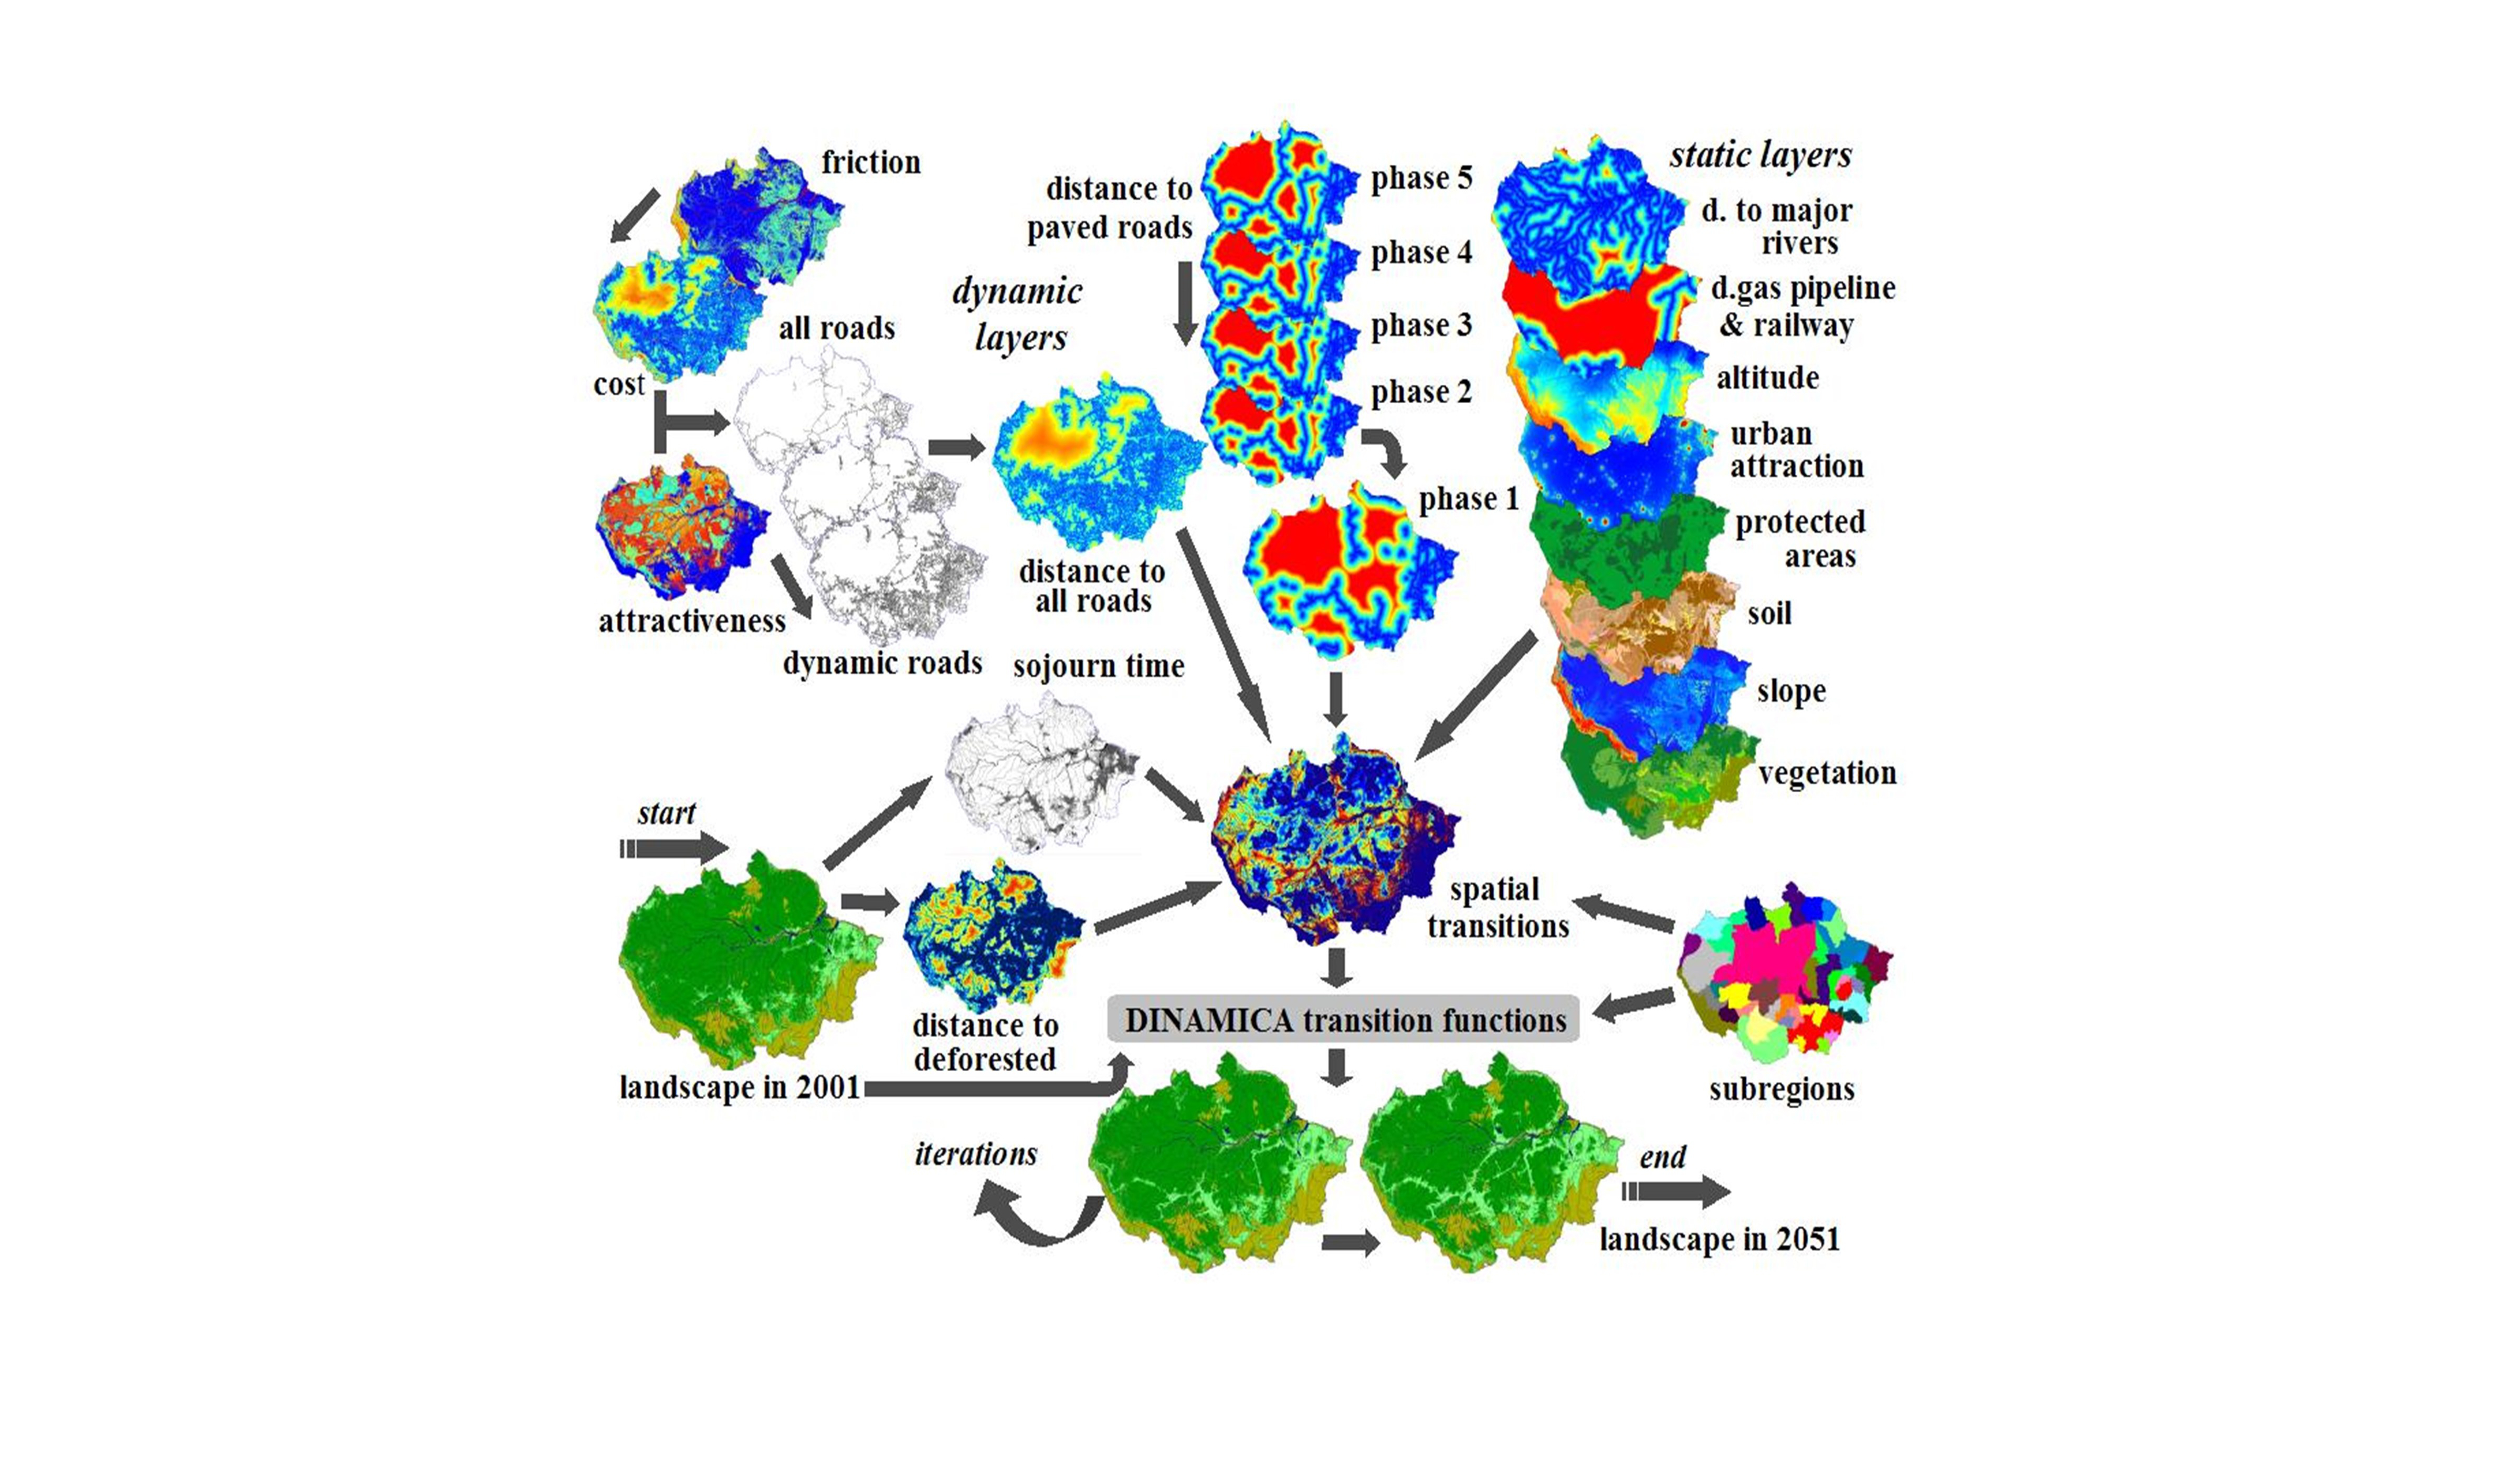
Input, derived, and simulated maps with respect to the spatial model architecture.
SIMAMAZONIA runs on DINAMICA. The DINAMICA software features multi-scale vicinity-based transition functions, the concept of phases and subregions, the use of data at various resolutions, feedback approach through the calculation of dynamic spatial variables, linkage between cellular automata and system thinking software, computation of spatial transition probabilities using either Weights of Evidence method or Genetic Algorithm, and a component that drives the expansion of the endogenous road* network. Interaction between subregions occurs by calculating chorographic variables over the entire landscape map.
View maps using our map server.
* Endogenous roads are roads built by loggers, ranchers, and spontaneous settlers or land thieves in order to provide access to the forest, and thus are considered coevolutionary with deforestation. View our endogenous road map for the Brazilian Amazon obtained by visual interpretation of Landsat imagery.
Basin stratification
Stratification of the Amazon Basin depicting annual deforestation and forest decline from 2001 to 2050 forecasted for the subregions shown with numbers keyed to their data in the paving schedule.
We ran the spatial model for seven scenarios as follows:
Historical: Current deforestation trends across the Basin and no further road paving.
Governance: All governance assumptions as previous version.
Governance without roads: All governance assumptions as previous version without further road paving
Business-as-usual Br-163: All BAU assumptions but only BR-158 and BR-163 paved after 2008.
Business-as-usual Assis-Cusco, All BAU assumptions but only BR-158 and “Interamericana” paved after 2008.
Business-as-usual Manaus Porto Velho, All BAU assumptions but only BR158 paved after 2008 and BR-319 paved after 2010.
Business-as-usual: All BAU assumptions as previous version: Current trends across the Basin plus extensive road paving according to a road paving schedule.
Deforestation forecast (average trend)
Results are analyzed for three regions
BR-163 area of influence
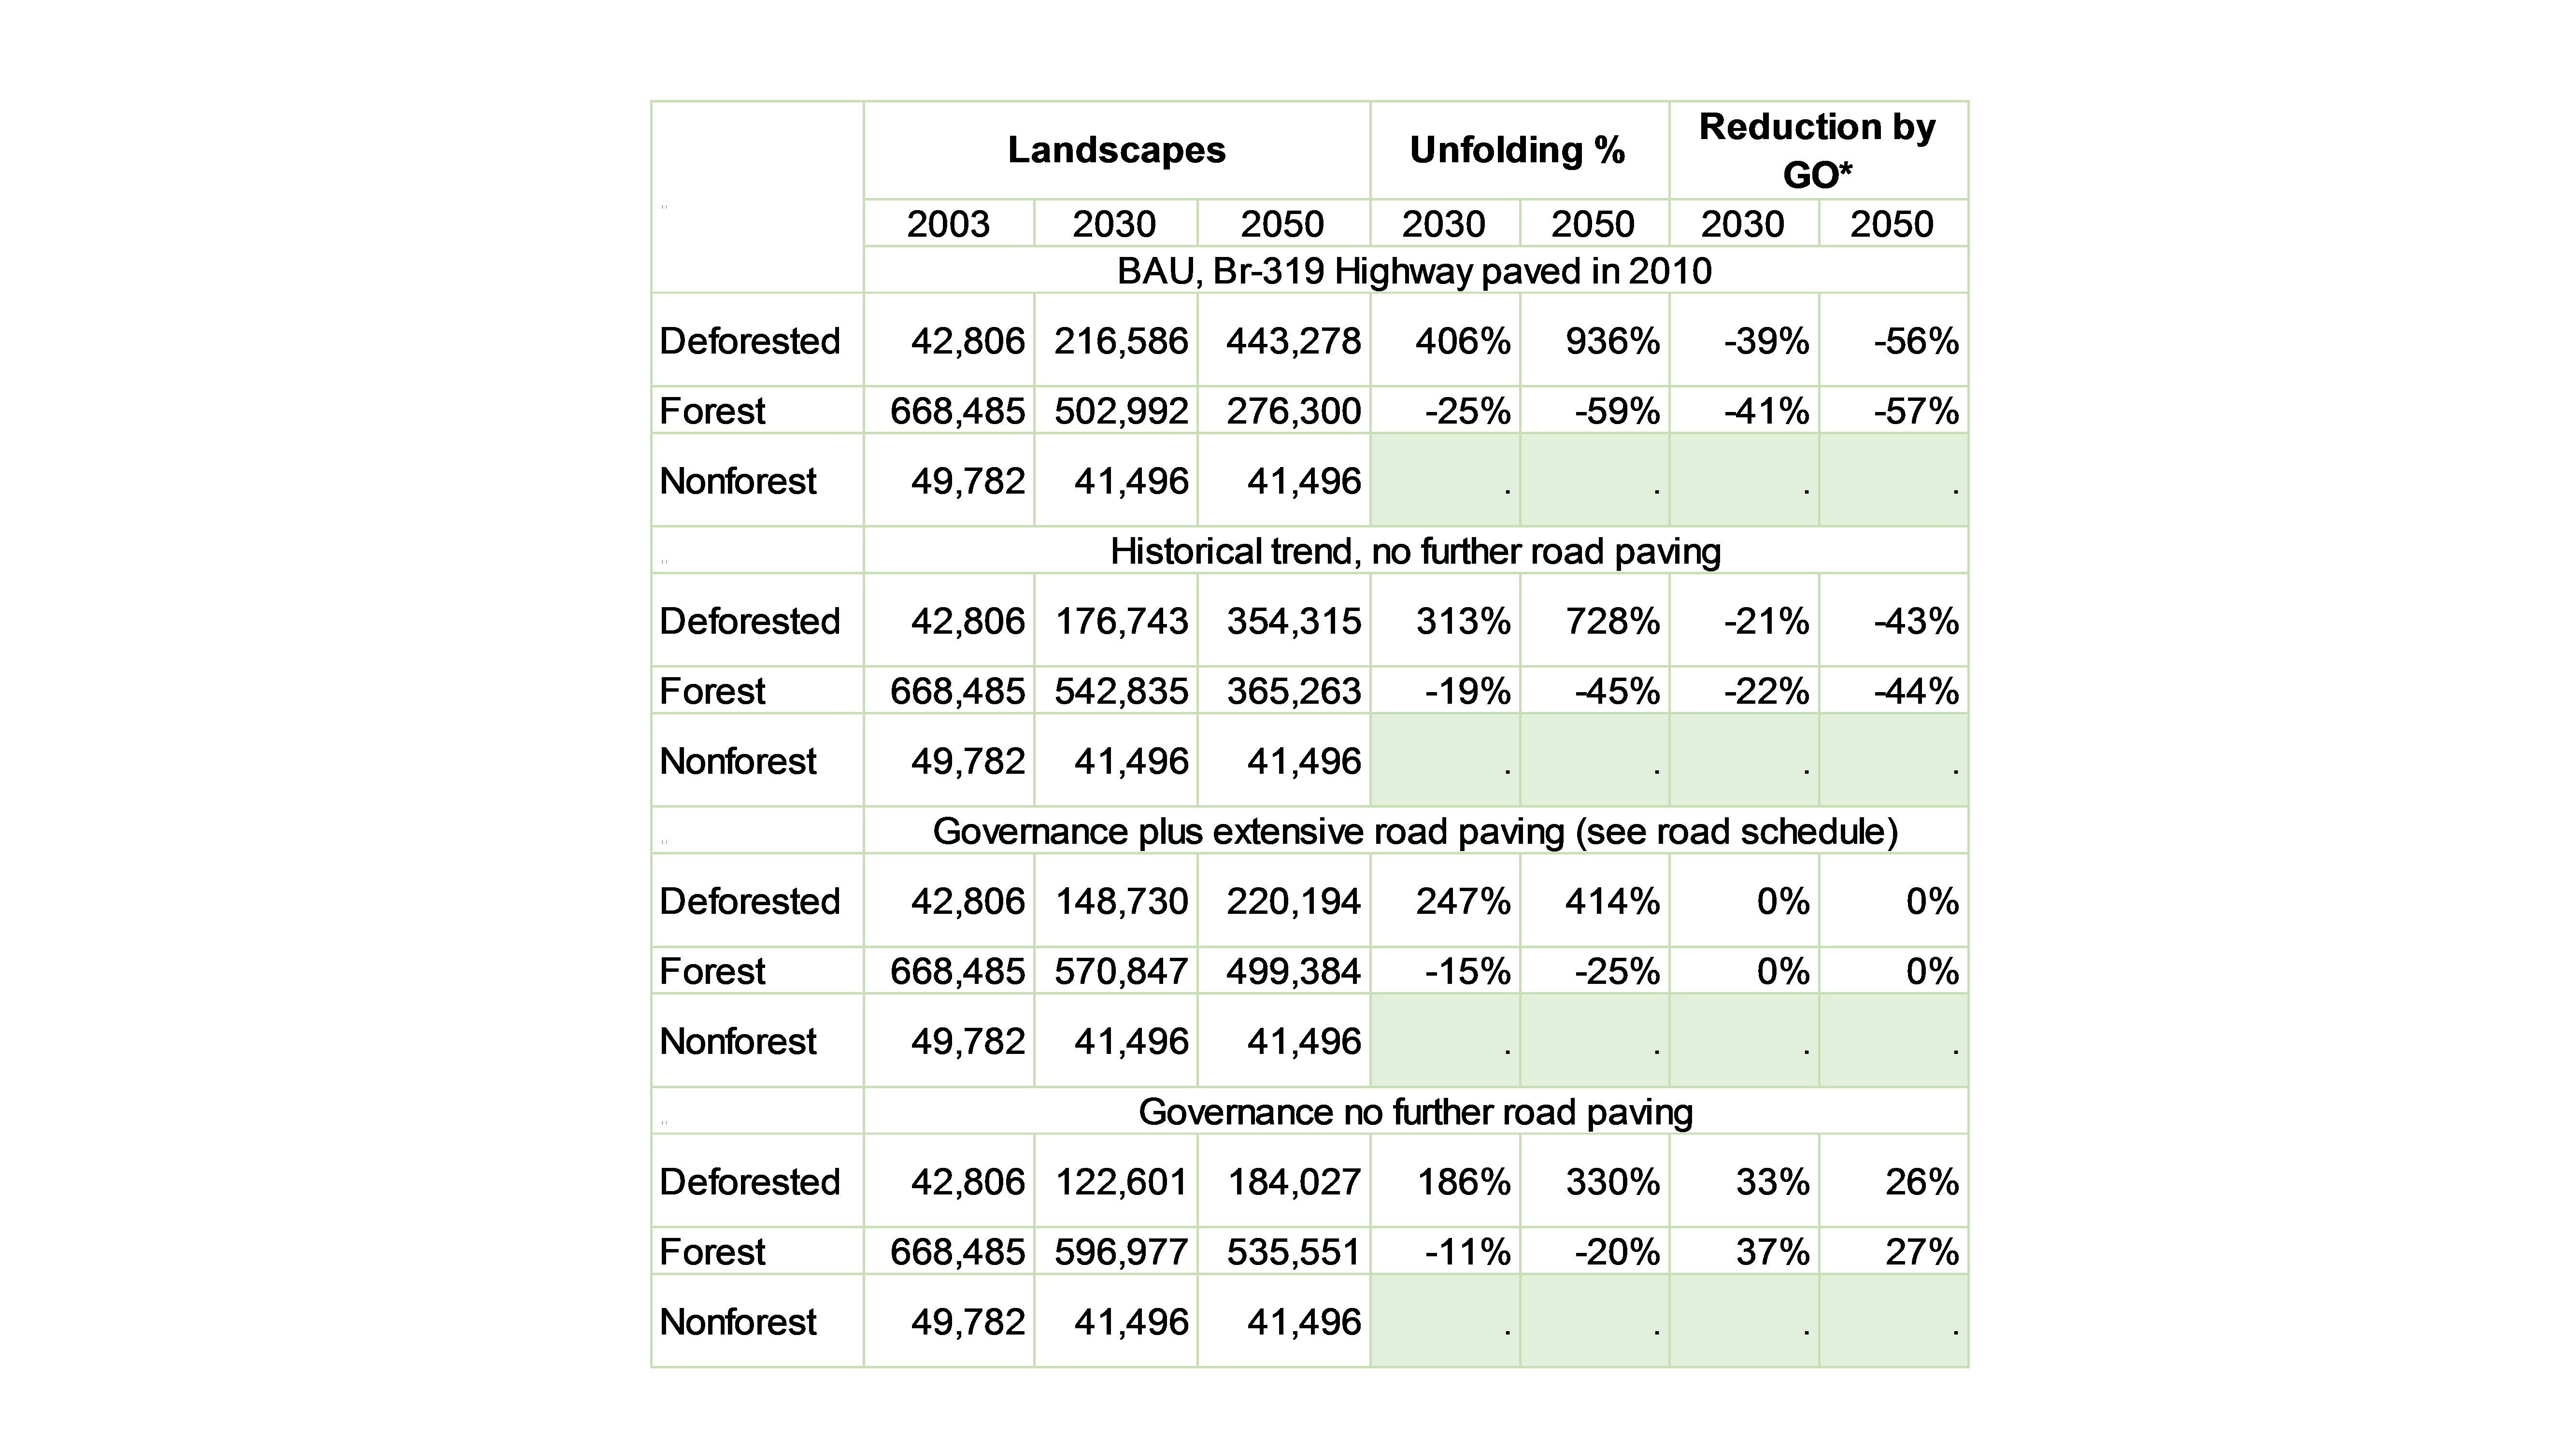
Manaus – Porto Velho area of influence (BR-319 )
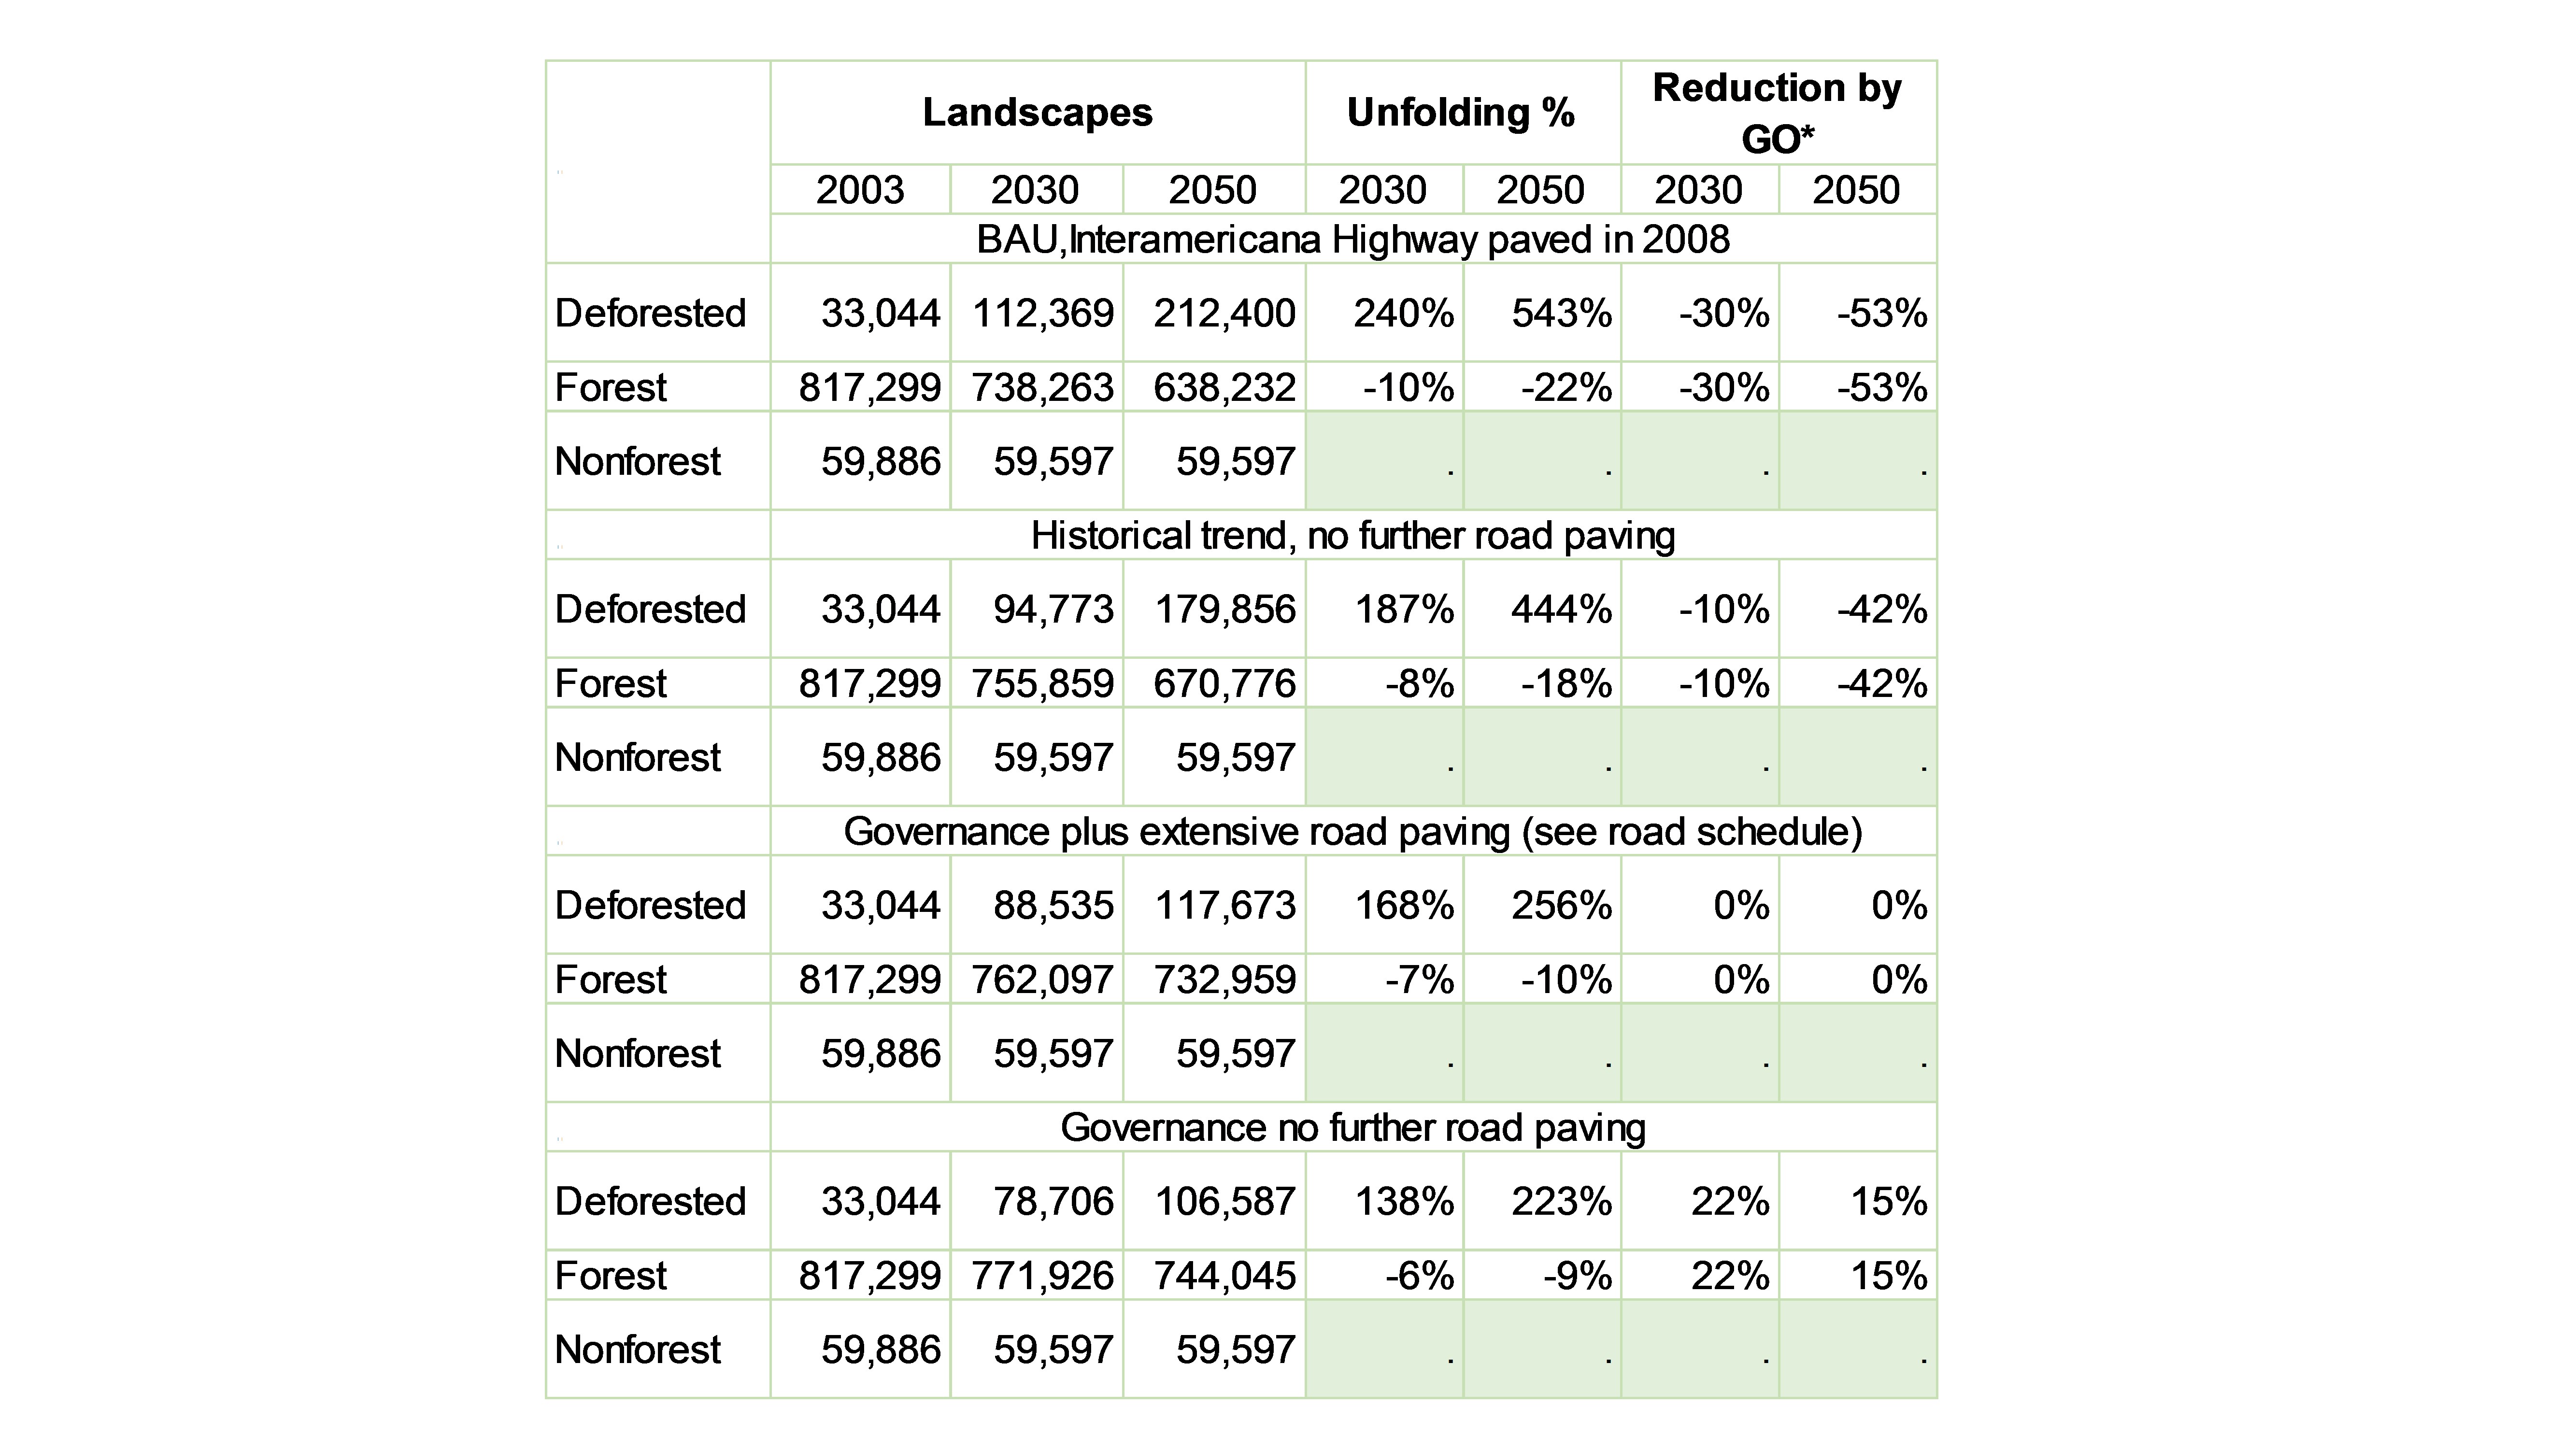
Assis-Cusco (interamericana area of influence)
BR-163 area of influence (2030)
BR-163 area of influence (2050)
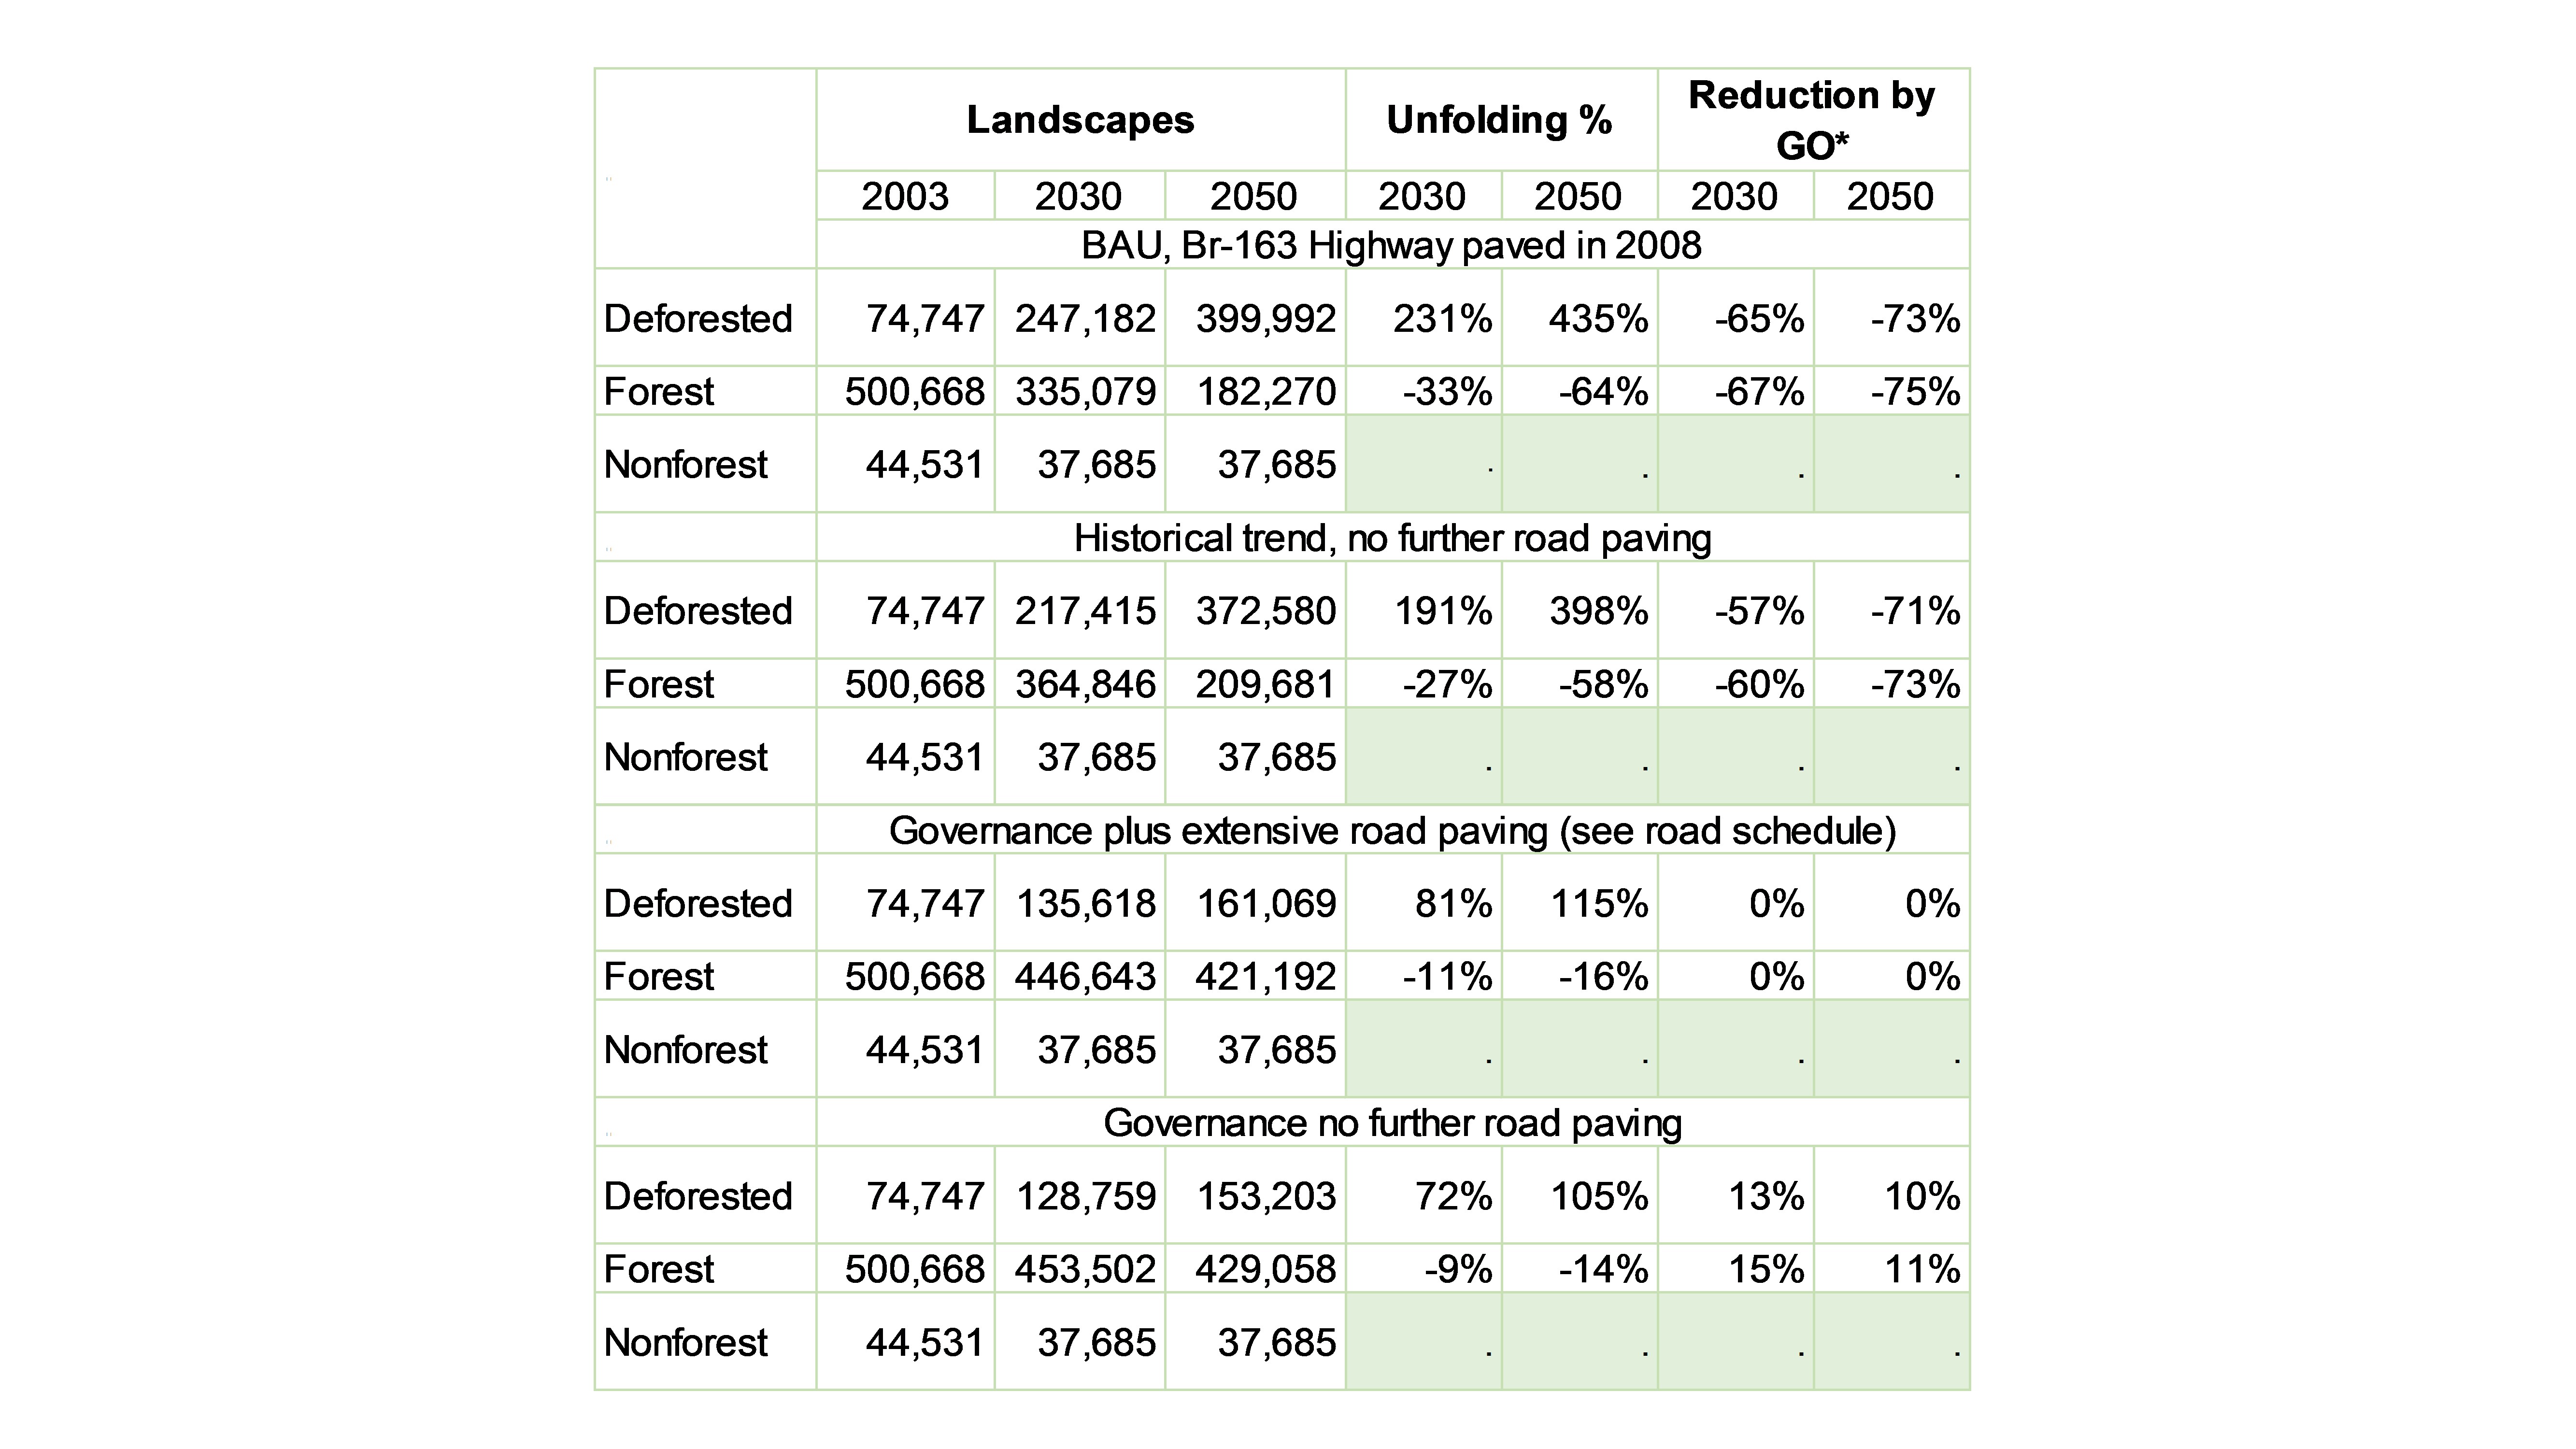
Summary statistics for BR-163
Manaus – Porto Velho area influence (2030)
Manaus-Porto Velho area influence (2050)

Sumarry statistcs for Manaus-PV
Assis-Cusco area of influence (2030)
Assis-Cusco area influence (2050)
Summary statistics for Interamericana Highway
Conclusions
Deforestation is already in full swing across the BR-163 area of influence, but road paving within a current business-as-usual scenario will further accelerate this process, leaving few changes to implement a comprehensive conservation of this region. Within a Business-as-usual scenario, the three major deforestation frontiers (Southern Para, Terra do Meio, and Transamazônica) will encounter by 2050. Notice the expressive influence of the expansion of the eastern deforestation frontier through Terra do Meio, Santarém surroundings and northeastwards. This was somewhat overlooked in face of Cuiabá-Santarém Highway paving debate, but this frontier should be regarded as equally important in terms of its potential impact. Of the three analyzed regions, this is the most critical whether paving occurs or not and thus a thorough implementation of a Governance scenario in the short run will be crucial for its conservation. Timing is decisive for this purpose.
Of the three regions, the Interamericana highway seems to produce the least effect on the regional deforestation. Nevertheless, its impacts propagate more intensely across the States of Acre and Amazonas than the Madre de Dios region.
In turn, road paving will make the largest difference over the Manaus Porto Velho region due its remoteness and large expanses of unprotected forest along its route; even within a Governance scenario deforestation tends to sharply increase, especially around Manaus city.
BUSINESS – Animation for the “business as usual” scenario
Results from “business as usual” scenario – ASCII – GEOTIFF
GOVERNANCE – Animation for the “governance” scenario
Results from “Governance” scenario – ASCII – GEOTIFF
FLY OVER AMAZONIA – 37 megabytes – use windows media player.

Access our Nature paper on SimAmazonia and its application to model conservation in the Amazon basin