Gini Coefficient Calculation
The Gini coefficient (also known as the Gini index or Gini ratio) is a measure of statistical dispersion developed by the Italian statistician and sociologist Corrado Gini and published in 1912.
The Gini coefficient measures the inequality among values of a frequency distribution (for example levels of income). A Gini coefficient of zero expresses perfect equality, where all values are the same (for example, where everyone has an exactly equal income).
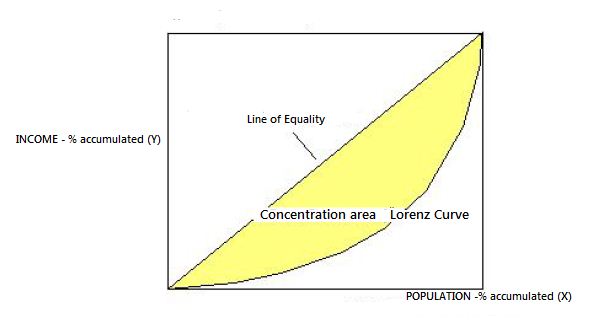
The Gini coefficient is usually defined mathematically based on the Lorenz curve, which plots the proportion of the total income of the population (y axis) that is cumulatively earned by the bottom x% of the population (see diagram). The line at 45 degrees thus represents perfect equality of incomes. The Gini coefficient can then be thought of as the ratio of the area that lies between the line of equality and the Lorenz curve.

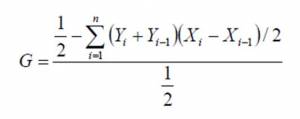
The area of concentration can be found by approximation by trapezoidal area of the Lorenz curve


In this work we calculate the inequality of the distribution of calories among rabbits at the end of each step.
The input to this submodel is a map in which the pixel value is the amount of calories of each rabbit.
First, the model divides the population in groups(k) and then calculates the inequality of calories distribution among these groups through the cumulative relative frequency of the population(X) and calories(Y).

