This is an old revision of the document!
Scenarios
In this model different scenarios were represented by different landscape maps(100×100 image). The amount and distribution of the resources were modified to analyze dynamic population of agents , agents movement patterns, resources depletion and many other model results in different enviroments.
Hom 100- This scenario represents a landscape where the resources are distributed equally across the space, like in a pasture, for example. In this way, every cell has the same value in this map: 100 - Summing 1000000 units of resources, average cell value: 100 -
Het 100 - This scenario represents a landscape where the resources are distributed differently across the space. There are three points with the highest concentrations of resources and this amount decreses with the distance to this points. In this way the cells have different values in this map: 0 to 147 - Summing 1000000 units of resources, average cell value: 100
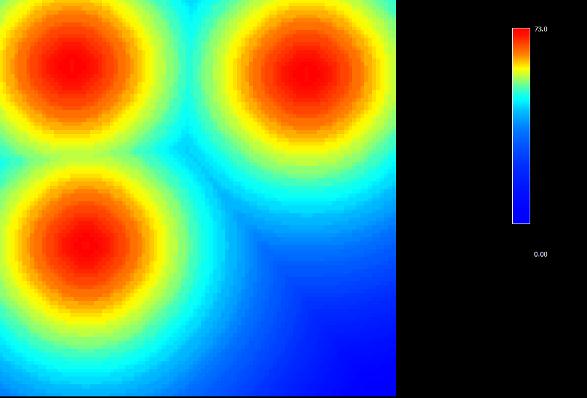
Het 50 - This scenario represents a landscape where the resources are distributed differently across the space. There are three points with the highest concentrations of resources and this amount decreses with the distance to this points. In this way the cells have different values in this map: 0 to 73 - Summing 500000 units of resources, average cell value: 50.


