This is an old revision of the document!
Calculate R Expression
The functor 'Calculate R Expression' allows Dinamica EGO to call R externally and process the script outputs as if they were part Dinamica itself.
Setup
There are two ways to setup the 'Calculate R Expression' functor:
R Plugin
There is a plugin that contains everything needed to wrap R scripts inside Dinamica EGO, just extract this file
to your Dinamica EGO installation folder (usually c:\Program Files\Dinamica EGO) and you will be good to go.
Local R Installation
Users can specify a local R installation to be used for execution, the pre requisites are:
- R needs to be at least at the 3.3.1 version.
- Rscript.exe must be valid and located at the 'installation folder\\bin' sub-folder.
- Dinamica package for R must be installed and at the latest version.
To specify your custom R installation, go to Tools → Options → External Comm tab and select 'Use alternative R installation for Calculate R Expression':

Usage
The functor is available under the 'External Communication' tab at the library.
Inputs
To pass input parameters from Dinamica EGO to R, hooks must be placed to collect data. You can use the 'Create a hook' button on
the selected functor bar or drag the hooks individually.
The valid hook types are:
- Number Table
- Number Value
- Number String
To access the passed inputs on your R script, follow Dinamica EGO naming conventions and use t[0-99], v[0-99], s[0-99] for each type respectively. For example:
# Will store the 5th key from the passed LookupTable in the variable 'testing'
testing <- t1$Keys[ 5 ];

# Store the second passed String.
secondString <- s2;

# Store the 10th passed Value.
tempNumber <- v10;
Outputs
To output data back to Dinamica EGO, the user must call a set of functions designed for this functionality:
| Function name | Output Data Type | Usage Example |
|---|---|---|
| outputDouble() | Real | outputDouble( “myDouble”, 3.14 ) |
| outputNumberVector() | Tuple | outputNumberVector( “myTuple”, c(1:10) ) |
| outputString() | String | outputString( “myString”, “This is a string” ) |
| outputLookupTable() | LookupTable | outputLookupTable( “myLUT”, c(1:10), c(1:10) * 10 ) |
| outputTable() | Table | outputTable( “myTable”, anyTable, 4 ) |
In the examples above, data was constructed inside the calling functions. You can also specify variables as parameters.
Keep in mind:
- You can pass any kind of numeric value on the outputDouble function.
- Collections of numbers are valid Number Vector's.
- A LookupTable requires 2 number vectors, one for the Keys and another for the Values. Both vectors must have the same number of elements.
Tables
Tables or LookupTables can be transferred to R using the Number Table functor. When dealing with each of these types extra caution must be taken:
Lookup Tables
LookupTables are transferred to R as a List with two columns, “Keys” and “Values”.
Each column can be individually accessed by using the $ operator, for example:
- t1$Keys[ 1 ] will access the first key of the LookupTable t1.
- t2$Values[ 2 ] will access the second value of the LookupTable t2
Tables
Tables are transferred to R as a DataFrame type variable. Each column can be individually accessed by using the $ operator, just like LookupTables.
Please check this page for more information on how to deal with Tables. The rules for them in Calculate R Expression are the same as sending and receiving through External Communication.
Example Scripts
Multiply each value of the passed LookupTable by itself.
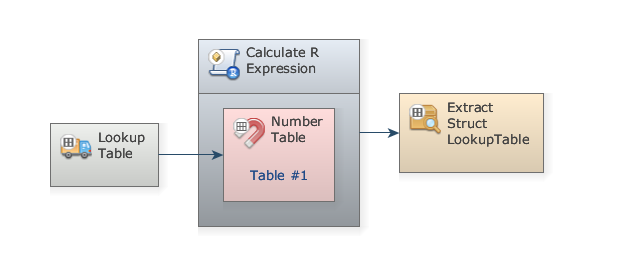 Expression:
for ( i in 1:length( t1$Values ) ) {
  tempValue <- t1$Values[ i ];
  t1$Values[ i ] = tempValue * tempValue;
}

outputLookupTable( "poweredTable", t1$Keys, t1$Values );
Extract the mean of passed LookupTable values.
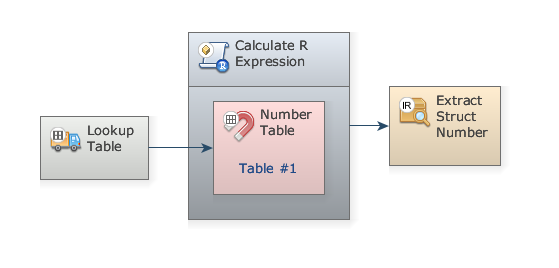 Expression:
tableMean <- mean( t1$Values );
print( paste( "Mean is", tableMean ) );
outputDouble( "mean", tableMean );
Noticed the print() statement? Dinamica EGO's Message Log will show output messages from the R script.
Plot passed LookupTable to an image on the path specified by passed String
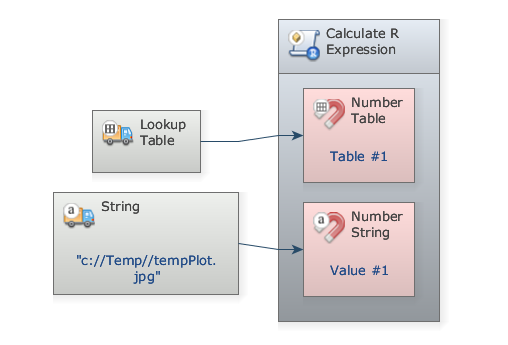 Expression:
outputFile  <- s1;
print( paste( "Plotting to", outputFile ) );
jpeg( outputFile, quality=100 );
plot( t1 );
dev.off();