Histogram Editor
The histogram window is responsible for assigning transformations from image original values (in any range) to palette range [0, 255]. The histogram curve will adjust any value smaller than the “From:” limit to 0, and any value greater than the “To:” limit to 255. Any other values will be mapped using the histogram curve to the “Y” coordinate on the color palette on the left.
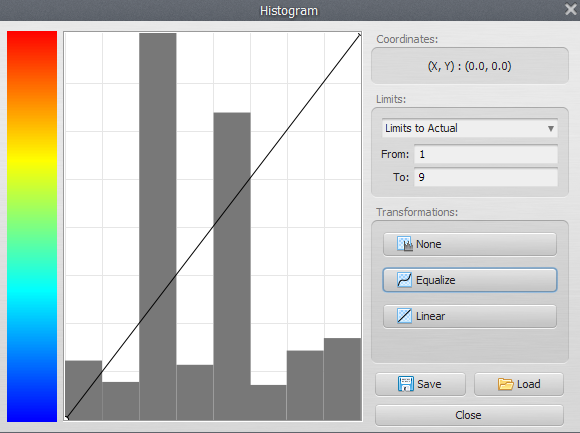
Histogram editor
Transformations
- None: The default transformation doesn't map any values, leaving cell values “as is”.
- Linear: This transformation will map linearly any values between the “from” and “to” ranges.
- Equalize: This transformation will construct a curve based on Equalization.