Our methods combine spatially-explicit modeling, economic analysis, and stakeholder engagement (semi-structured interviews and focus group with selected agents in the Brazil nut market chain).
The Brazil nut model includes the following components:
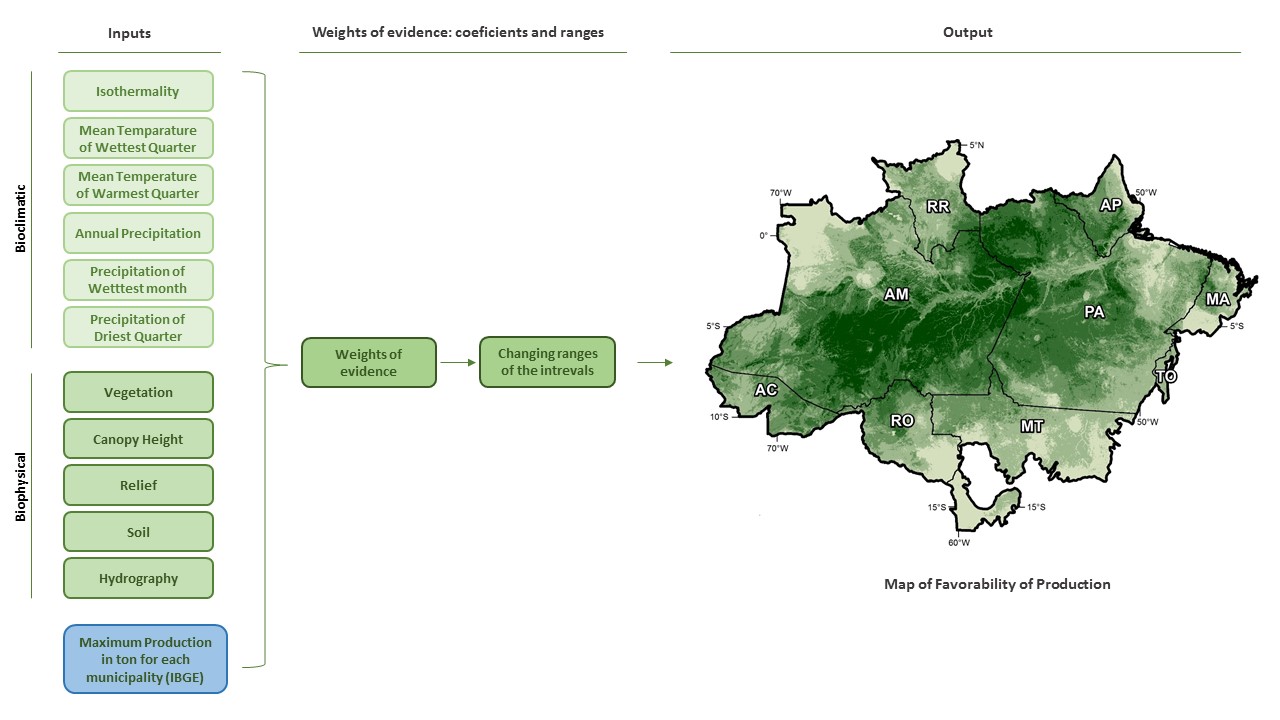
The model begins by using the Weights of Evidence method to estimate the effect of a set bioclimatic and biophysical variables on yields (Nunes et al. [1]). We use maximum production (IBGE [2]) over the past 20 years as a surrogate for current production capacity.
Favorability was then transformed into yield by applying a mathematical transformation so that the new PDF (Probability Distribution Function) matches the yield PDF from the case study areas in Acre [1]. Nunes et al. [1] used fieldwork data on tree occurrence and productivity for estimating Brazil nut tree density and yields; we extrapolated the Acre estimation to the Brazilian Amazon.
Brazil nut price varies seasonally and yearly. Price is also adjusted depending on the value chain, namely whether it is marketed through cooperatives (approximately US$ 1.48) or intermediaries (price varies from US$ 1.06 to 1.90 per kg of unshelled nuts) and depending on the data source used (e.g. IBGE [2] or CONAB [3]). We confirmed the different estimates during data collection in our fieldwork. In the model, we selected the maximum price paid to collectors in the period 2013 to 2014 from the CONAB dataset [3] as the most accurate and replicable.
Brazil nut collection comprises several steps including: collecting the nuts and their temporary storage in the forest; breaking the outer shell “ouriço”; and transporting the nuts within the forest and from communities to the nearest cooperative. Our estimates of production cost vary by site productivity. In our model, we assume that the nuts are only shelled in the cooperatives.
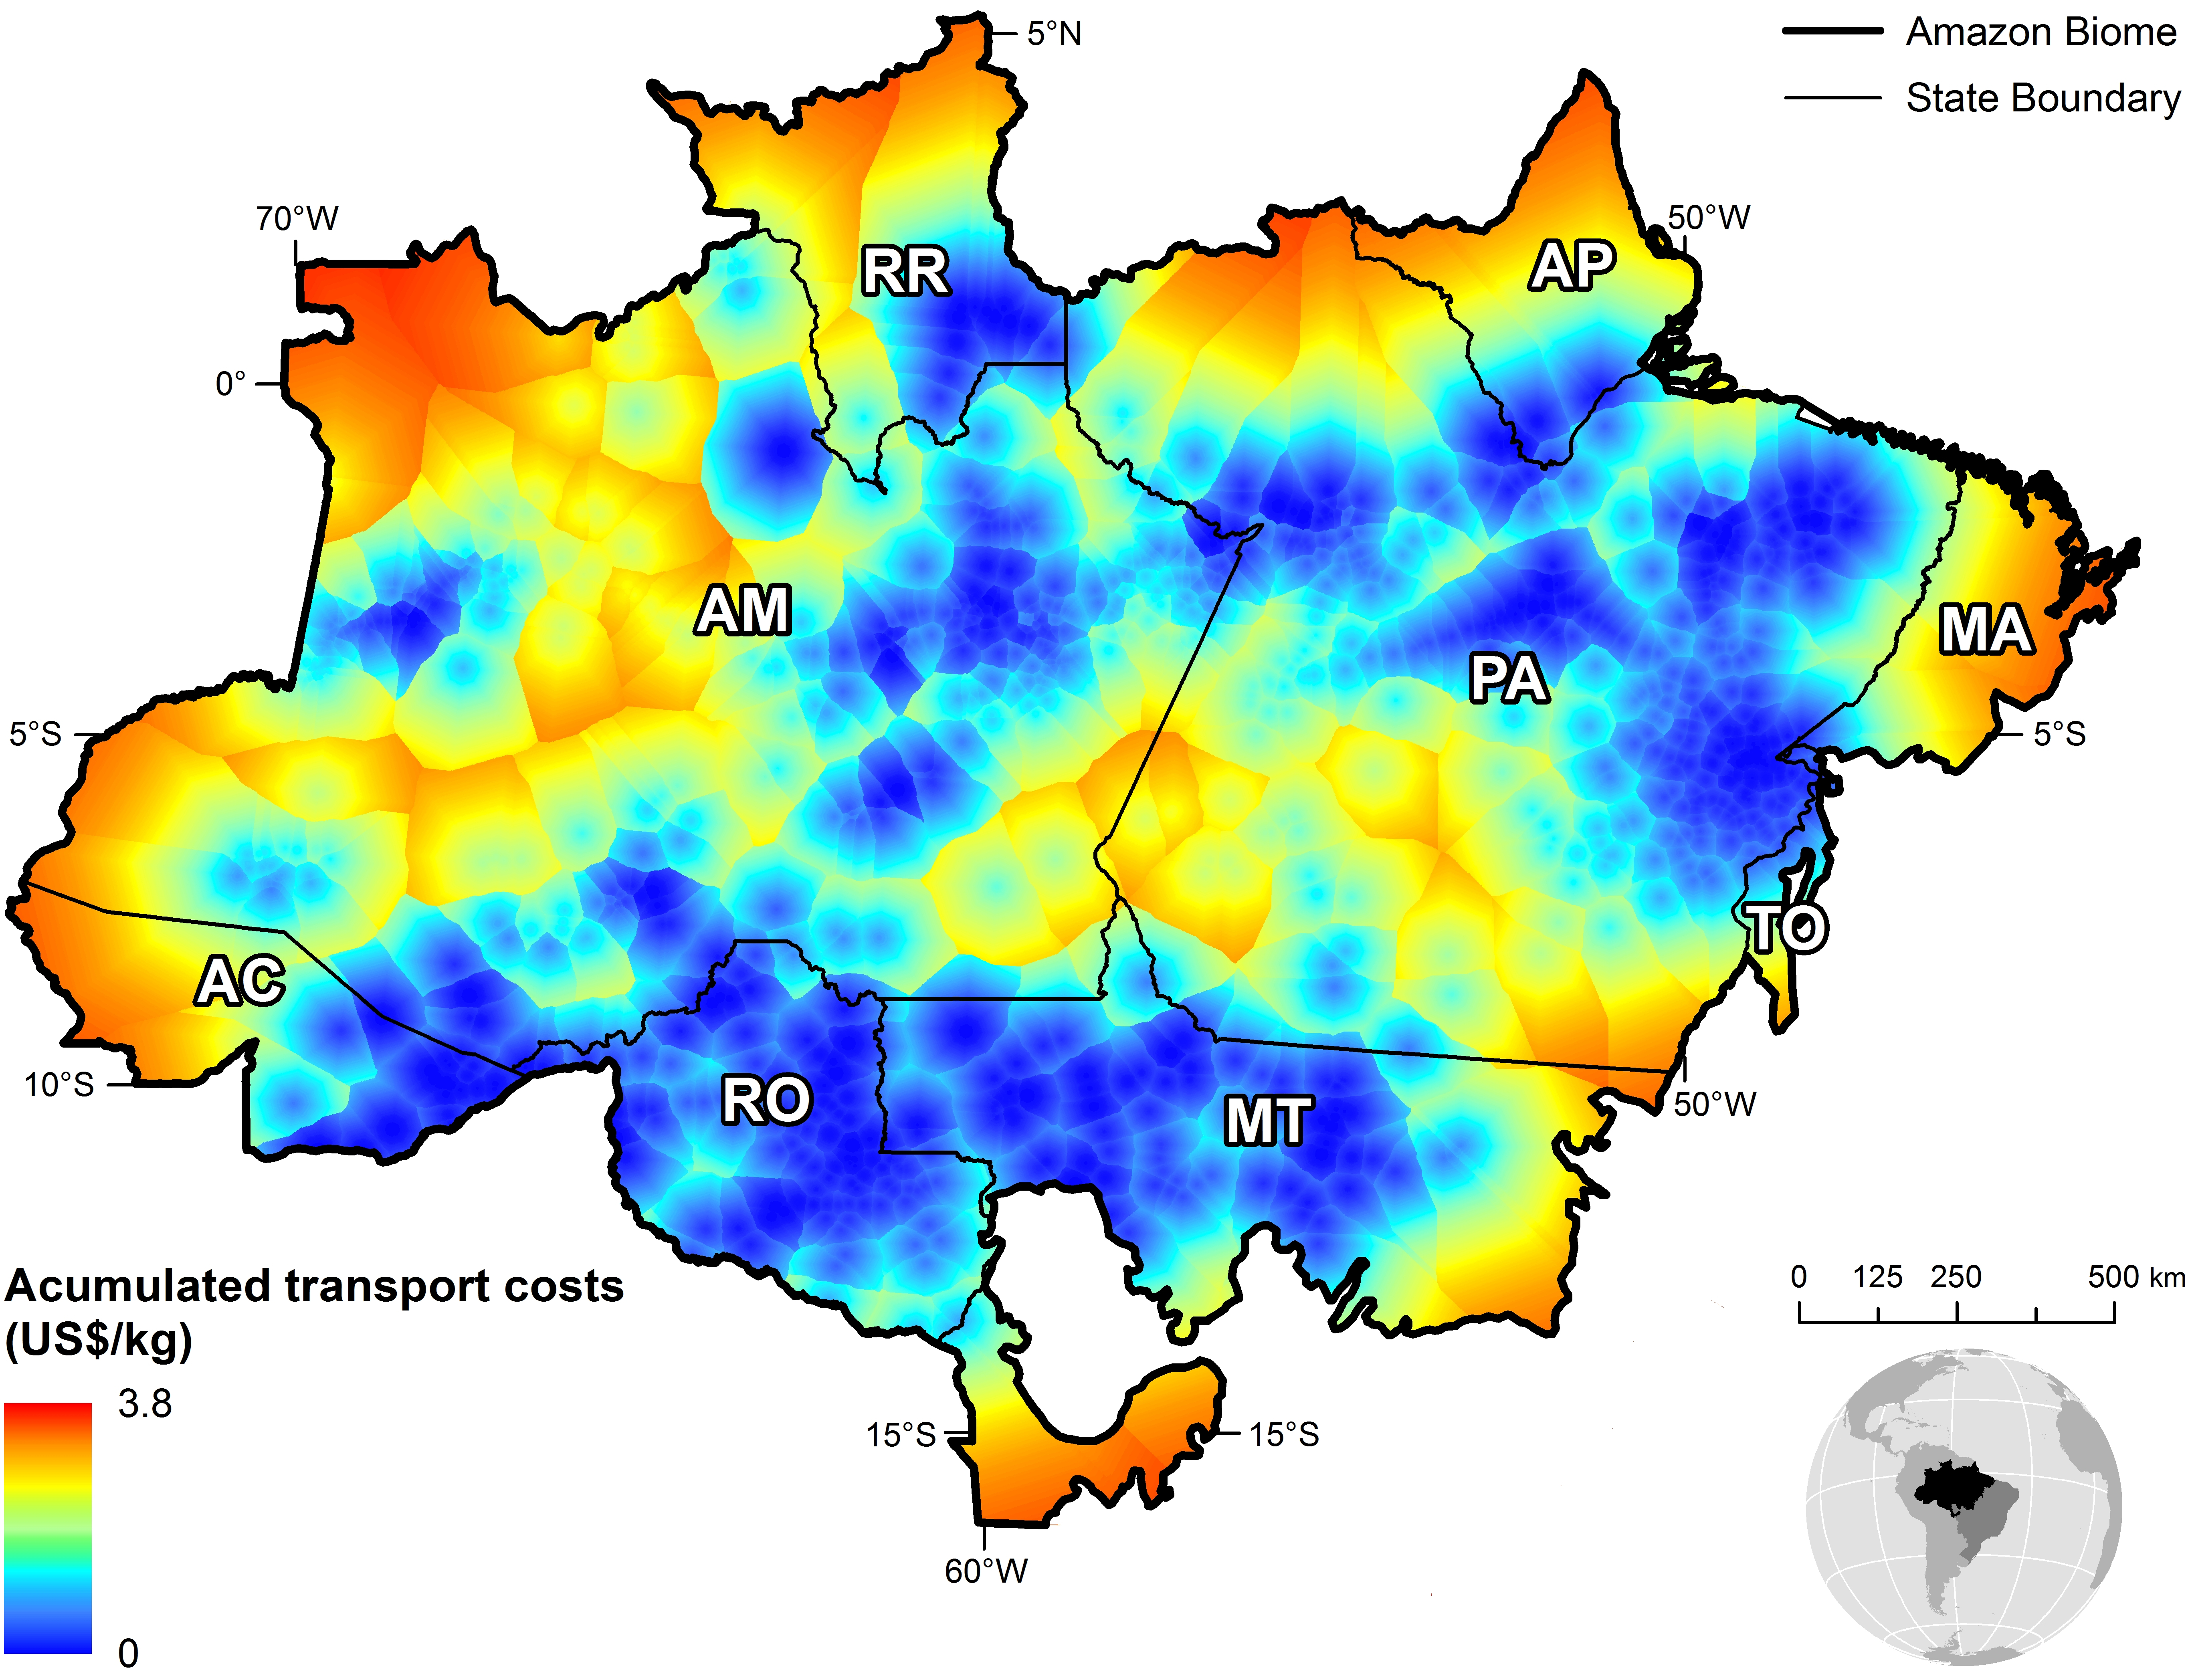
The economic analysis combines the map of estimated productivity with prices, collection costs, and transport costs to estimate spatially explicit returns to Brazil nut production per hectare across the Amazon biome. The initial rent per hectare is estimated by multiplying the sale price of the simulated total production for a specific cell, and by subtracting the total costs of production and transportation to the closest distribution center or collection points (storehouses) and then to selling points (cooperative), see figure below, according to the following equation:
Rent xy,n= Qxy (Pn-Cn-Txy,n,t)
where Qxy, is the simulated productivity for a cell with geographic coordinates (x) and (y) in kg, Pn is the sale price and Cn the cost of production in US$, and Txy,n,t is the transportation cost by type of transport (t) from location (x,y) to the nearest point of sale.
1. Nunes, F.S., Soares Filho, B., and Rodrigues, H. Valorando a floresta em pé: A rentabilidade da castanha do Brasil no Acre, in IX Encontro Nacional da Ecoeco. Brasília: 2011.
2. IBGE – Instituto Brasileiro de Geografia e Estatística. Produção da Extração Vegetal e da Silvicultura. 2015. Available from: https://www.ibge.gov.br/home/estatistica/economia/pevs/2013/default.shtm.
3. CONAB – Companhia Nacional de Abastecimento. Castanha do Brasil, conjuntura mensal. 2012.
Download report