Sustainable forestry management (RIL) generally assumes a harvest cycle of 25 or 30 years. This implies that an area under sustainable forestry management is divided into annual production units. In each one of the annual production units, according to CONAMA resolution Nº 406/2009, the maximum yearly extraction is set at 0.86 m3/ha multiplied by the number of years of the harvest cycle. Therefore, the SimMadeira+ model, which uses a 30 year cycle, establishes an annual harvest limit of 25.8 m3/ha (0.86*30 years).
SimMadeira + includes the following components and results:
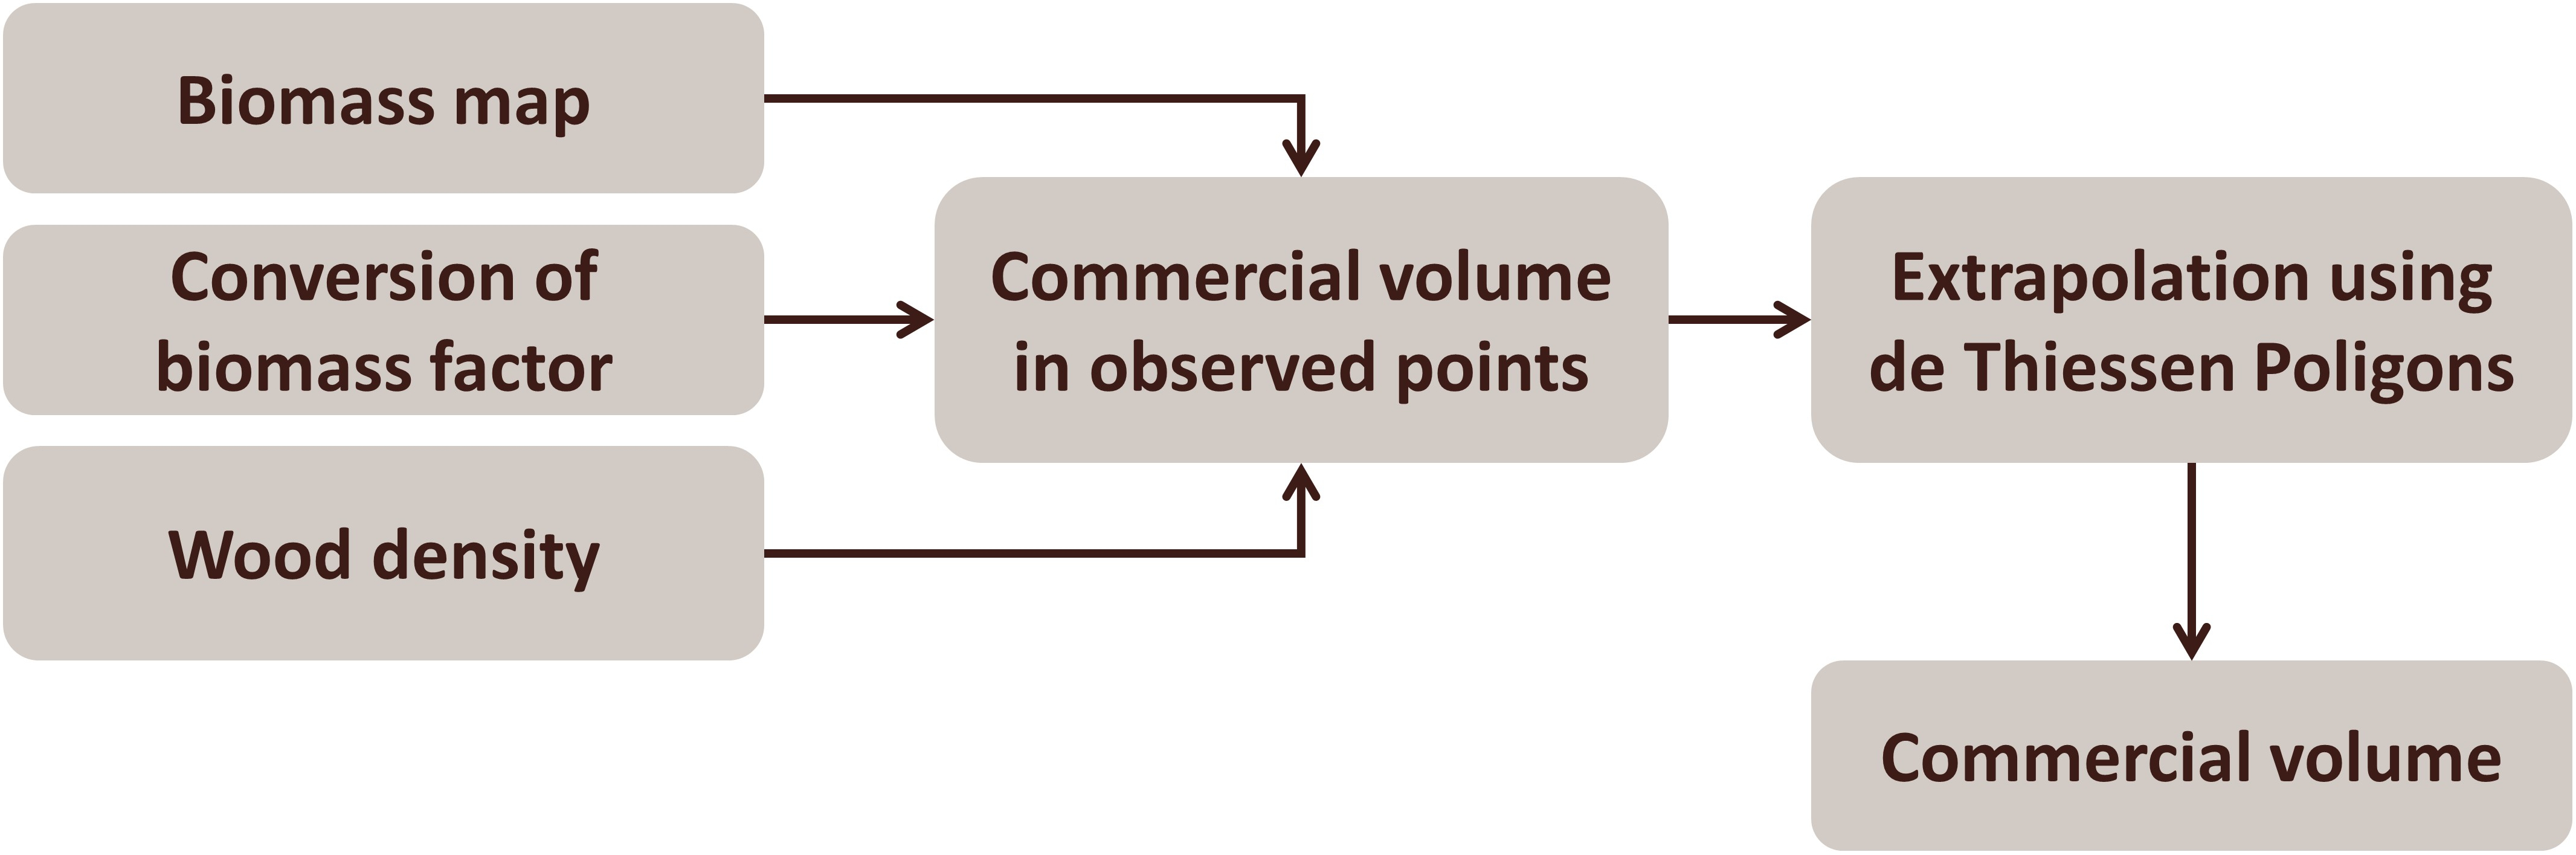
An initial commercial wood volume map comes from Merry et al. [1], which converted biomass into roundwood volume using wood density coefficients (in ton/ha) as well as a biomass expansion factor [2,3] (See map server).
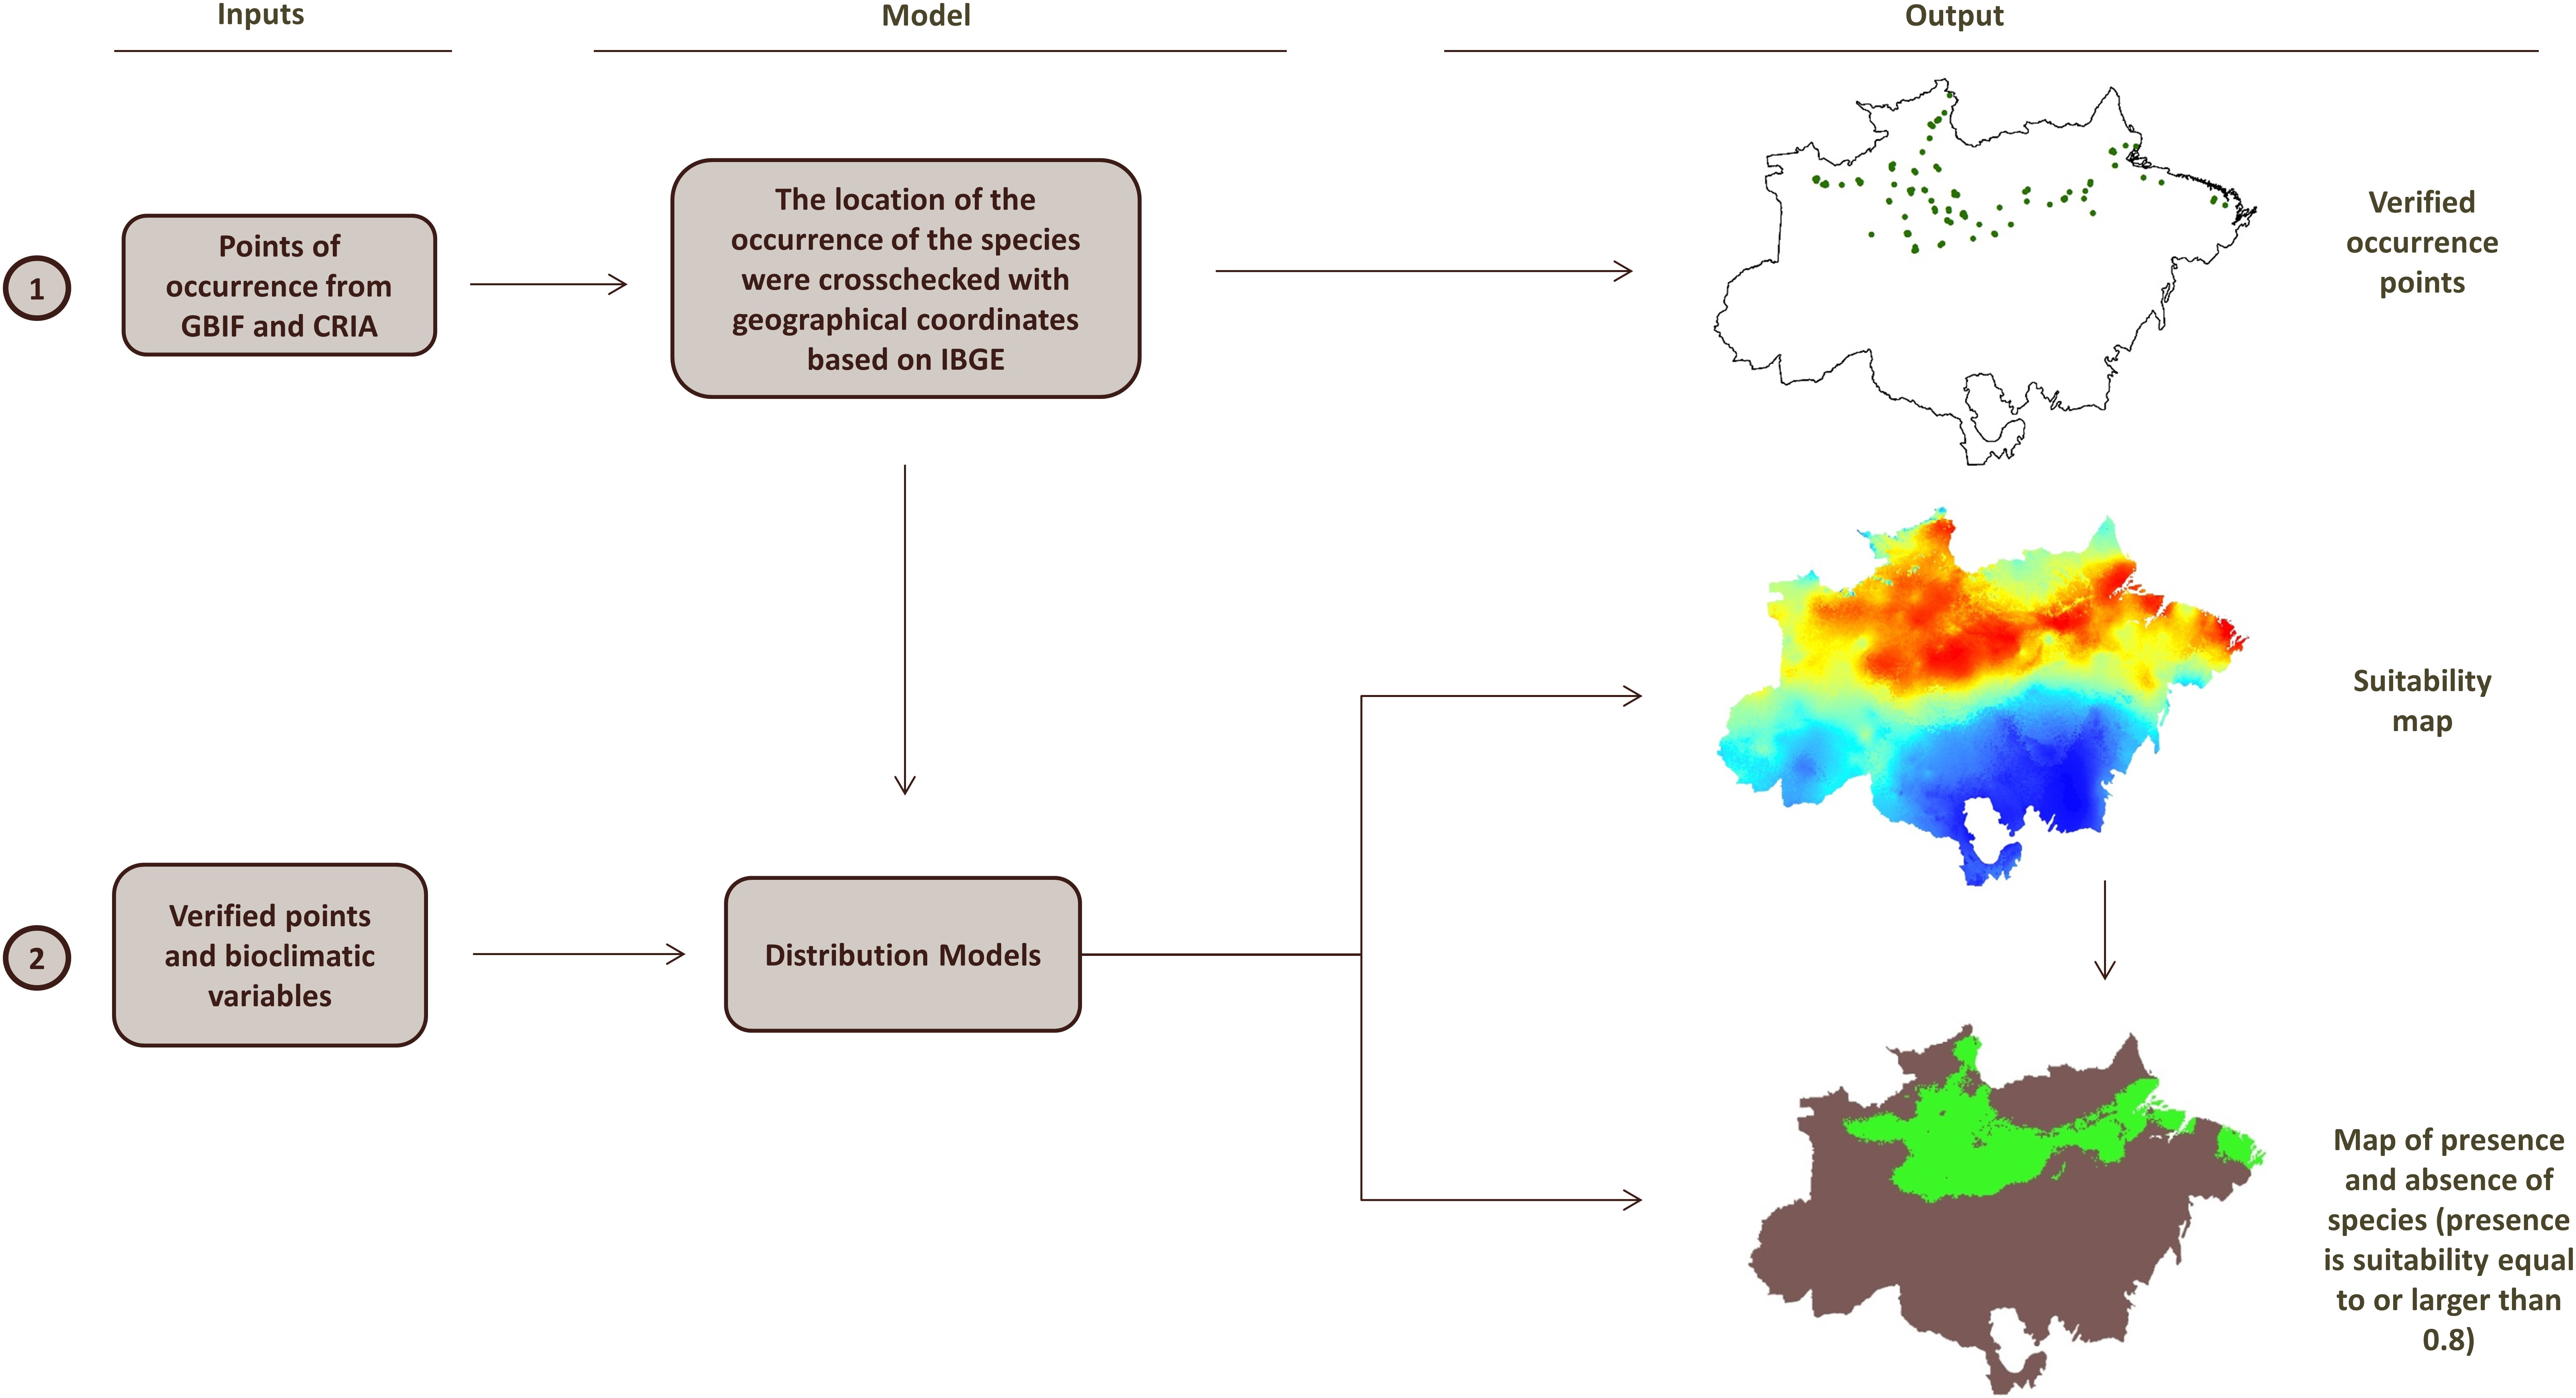
We divided commercial timber into soft and hardwood categories based on a list of the 40 most common commercial timber identified originally by IMAZON [4]. After which a tree-species distribution model was developed. This procedure relied on the tree species database provided by the Global Biodiversity Information Facility (GBIF) [5] and Reference Center on Environmental Information (CRIA) [6].
To devise occurrence maps for each of the 40 timber types, the data from CRIA and GBIF were analyzed in relation to 19 predictive bioclimatic variables obtained from WorldClim [7] plus elevation data for South America region. First, the bioclimatic and elevation data were preprocessed to avoid data collinearity. Then, a principal component analysis (PCA) identified that only the first four axes were statistically significant, representing 89.4% of the variance of the predictive variables. These variables were transformed into raster maps and analyzed in relation to the tree species dataset using relevant species distribution models: Bioclim, Domain, Mahalanobis distance, Maxent, Garp and SVM [8,9]. We then used the model to build maps of presence/absence of each tree species based on minimum value of suitability observed in the samples.
Next, we estimated the commercial volume for each timber type. We expanded the map of commercial volume to differentiate the total commercial timber volume by timber type based on the genus distribution maps. To account for the relative abundance of tree species, we used Amazon-wide population distributions of 4,962 species estimated by Steege et al. [10].
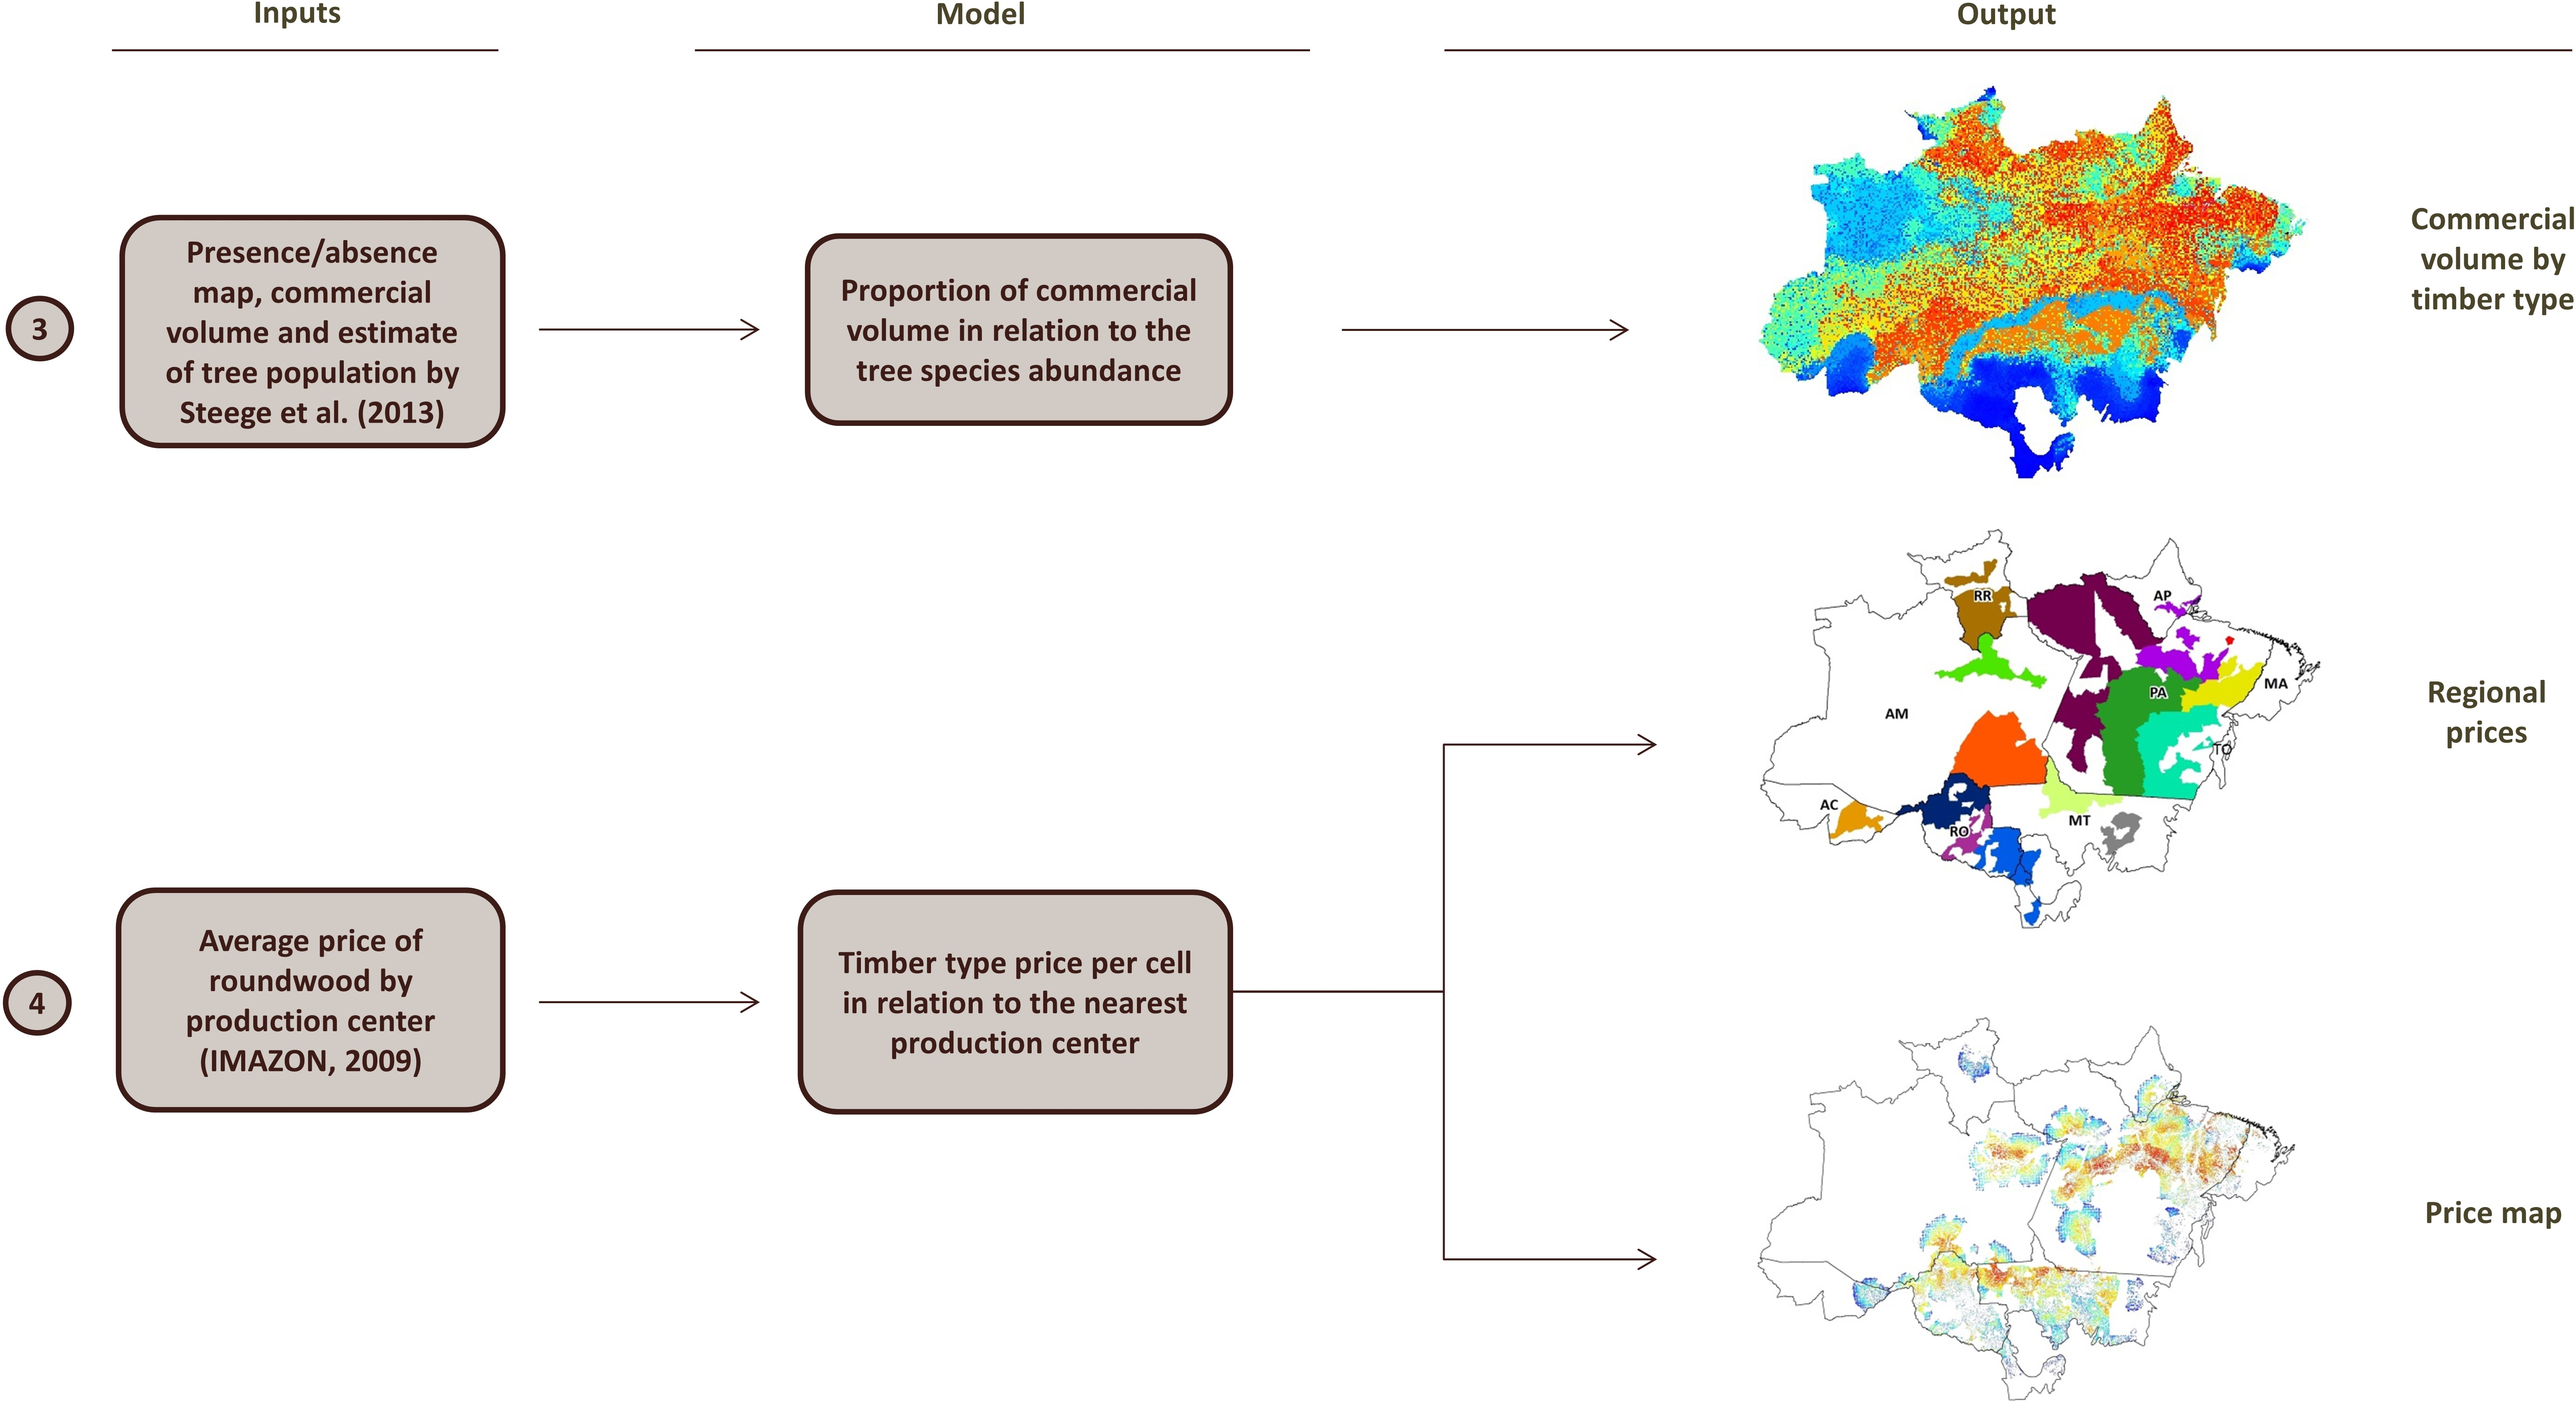
To calculate the gross revenue of timber production for each cell of 100 ha, the maps of commercial timber volume, separated by timber genus, were combined with roundwood prices. IMAZON [4] provides the average prices of high, medium, and low value timber for each of the 15 main timber production centers in the Brazilian Amazon. We used this price dataset to obtain an estimate of the price of the 40 tree genus for each of the 15 timber production centers in the Amazon.
The profitability of sustainable timber is then calculated as a residual value from the mill gate to the forest by subtracting transportation, harvest, and opportunity costs. The resulting value is described as the stumpage price. The stumpage price is multiplied by commercial volume at each land unit to arrive at an estimate of forest rent for the land unit (US$/ha). Stumpage price πj, for a cell j is calculated as follows:
πj,=[Vj*(Pj*-(TCj+HC)]*(1+I)
Where Vj is the available commercial volume, Pj is the price of roundwood at the milling gate, TCj is the transportation cost of roundwood from a specific cell j to the location of the nearest milling center, HC is the harvest cost, and I is the rate of interest (the model assumed an interest rate of 5%).

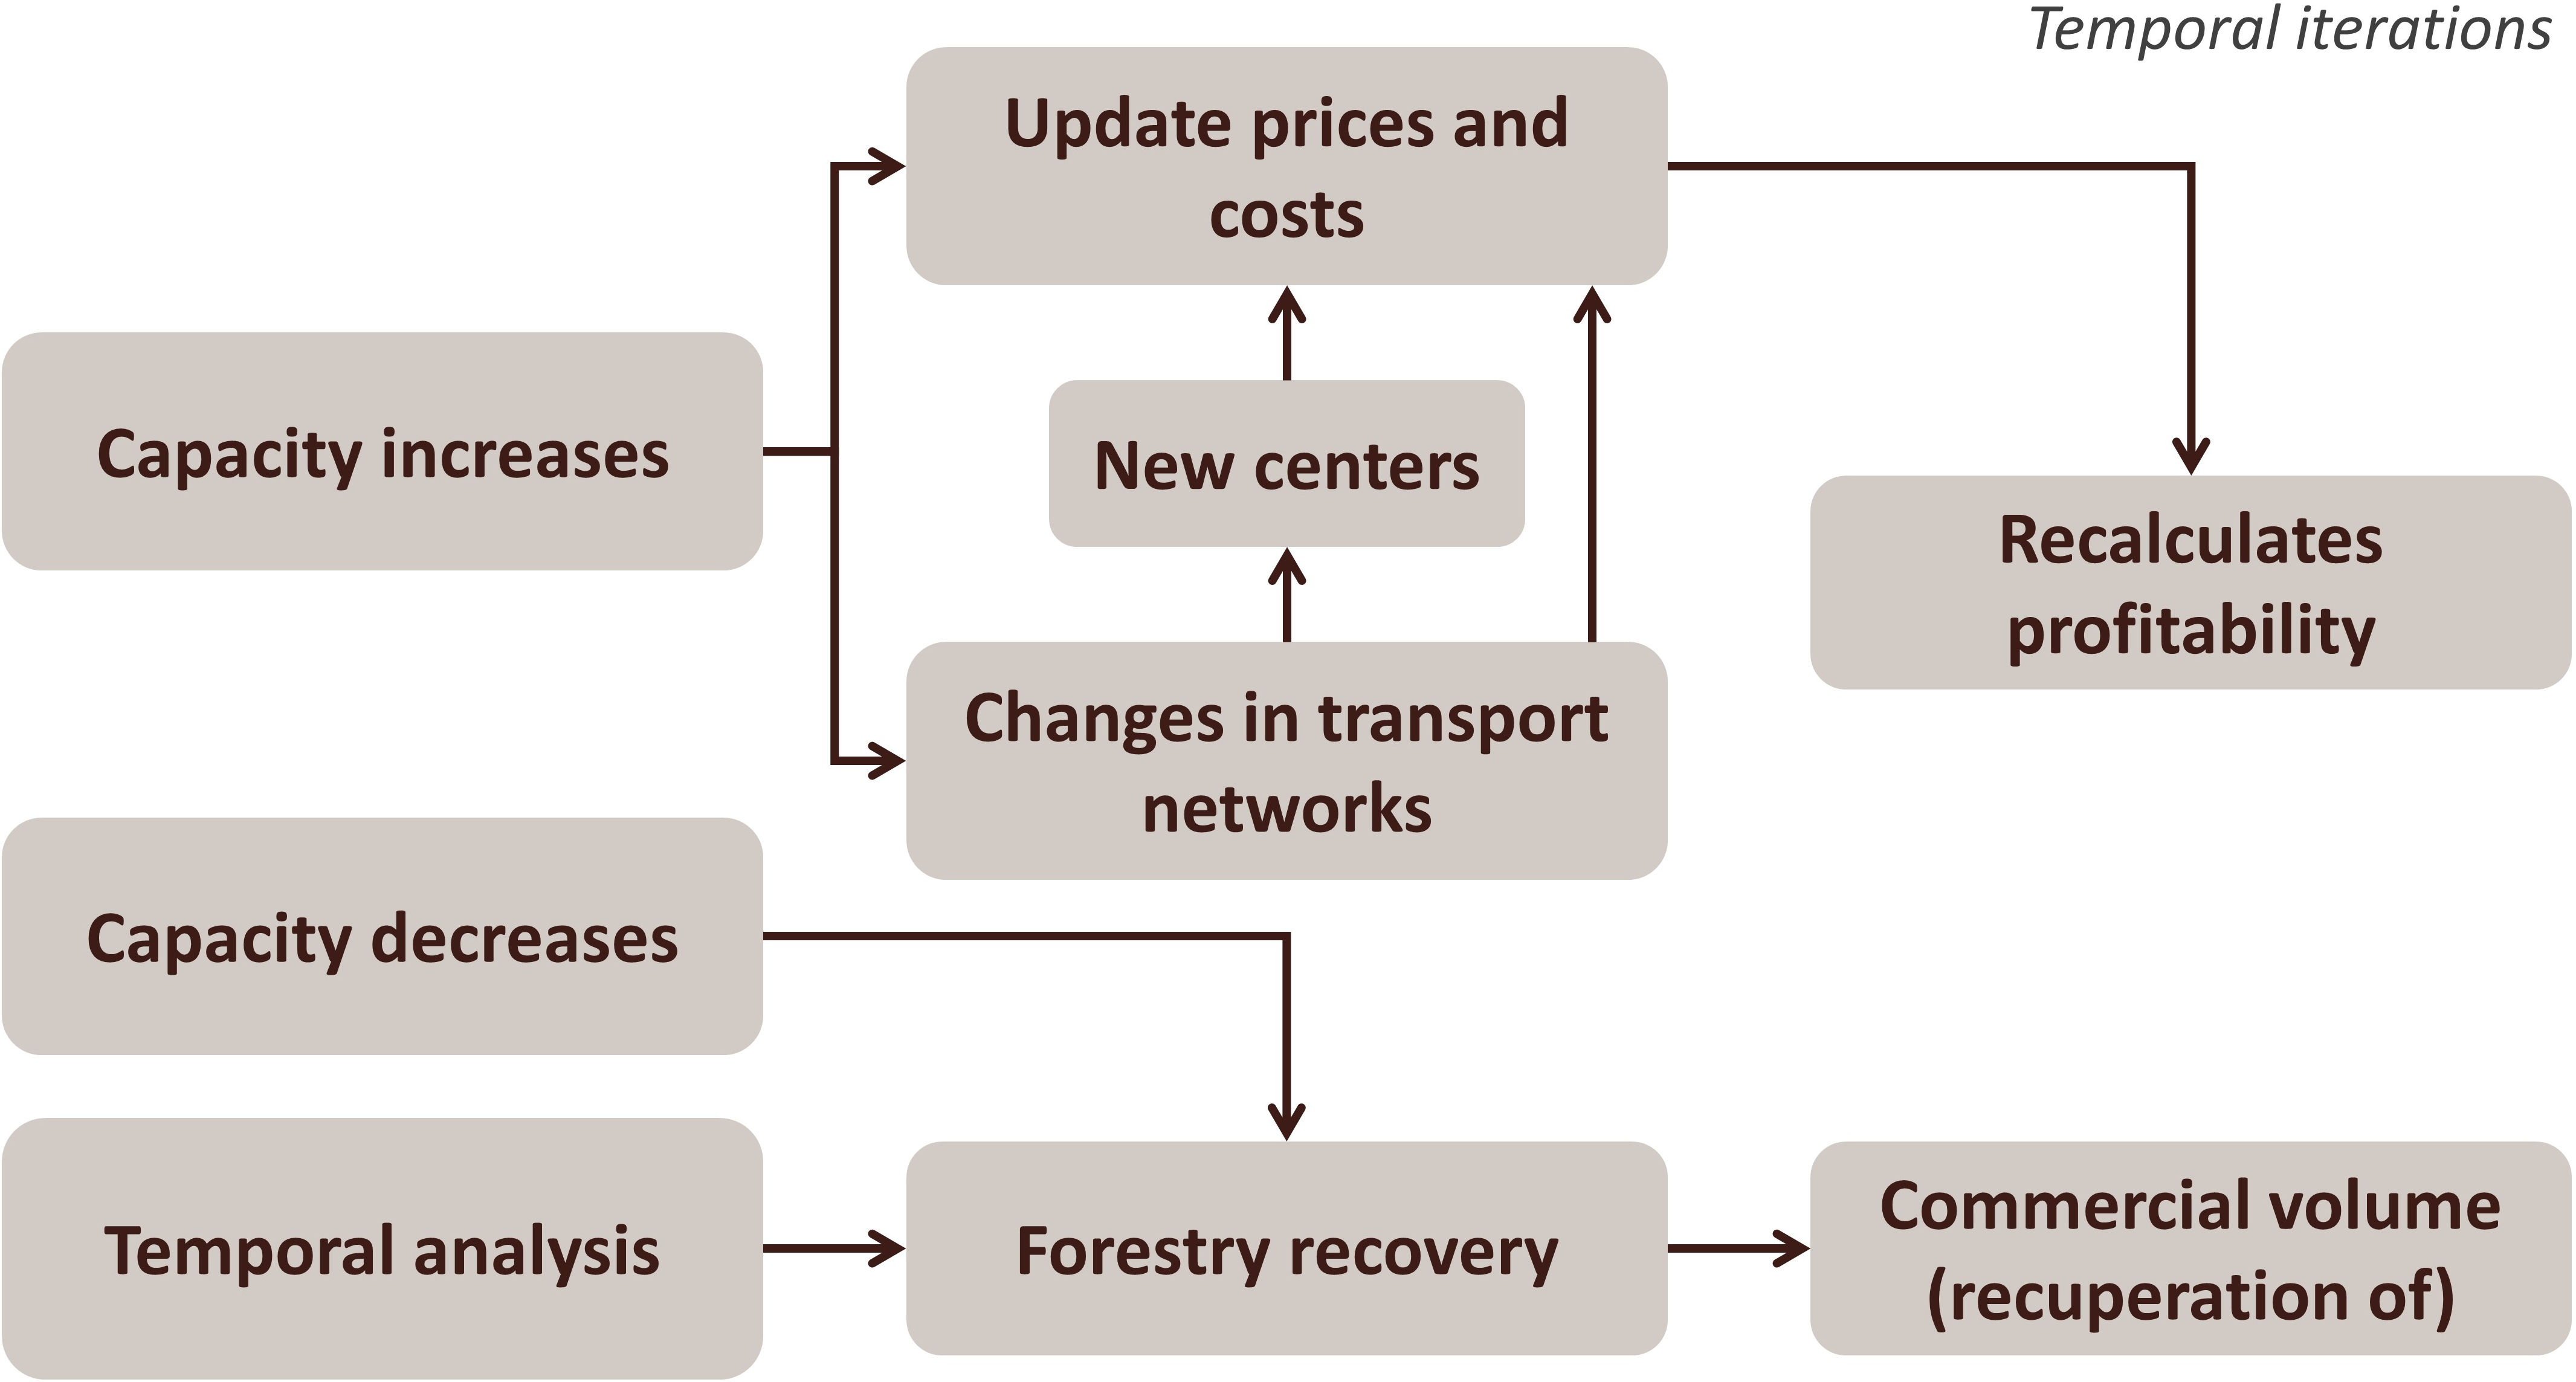
SimMadeira+ also simulates improved access, and thus reductions in transportation costs, by expanding logging roads and skid trails. The model simulates the building of logging roads and skid trails as new harvest occurs. As forest parcels are logged and roads are built, the transportation cost declines and the cost surface is updated.
To account for uncertainty in future timber prices, we ran SimMadeira+ under two scenarios of timber prices: current prices and inflated prices by 15% in relation to input costs. This allowed us to include uncertainty bounds in the model’s estimates.
The model calculates net present value (NPV, 5% discount rate) for timber considering a 30 years harvest cycle. The model then calculates the Equivalent Annual Annuity (EAA) by deriving a dollar value of the project/activity that is spread equally over the lifespan of the project. This allows us to compare financial returns from two or more projects, or in this case land use alternatives, with differing timelines.
See detailed methodology by accessing the full report.
1. Merry, F. et al. Balancing Conservation and Economic Sustainability: The Future of the Amazon Timber Industry. Environmental Management., 2009. 44(3): p. 395-407.
2. Brown, S. Estimating Biomass and Biomass Change of Tropical Forests: a Primer. FAO Forestry Paper, 1997: p. 134.
3. Saatchi, S. et al. Distribution of aboveground live biomass in the Amazon basin. Global Change Biology, 2007. 13: p. 816-837.
4. IMAZON – Instituto do Homem e Meio Ambiente da Amazônia. Acompanhamento dos preços médios de madeira em tora extraída de florestas naturais da Amazônia. Produto 2: Relatório Técnico Parcial; Tabela: 2, pag. 11 – preços; Tabela 3, pag. 12 – custos de exploração. Contrato Administrativo 06/2009 com Serviço Florestal Brasileiro. Brasília: IMAZON, 2009.
5. GBIF – Global Biodiversity Information Facility. Data species occurrences. 2015. Available from:
6. CRIA – Reference Center on Environmental Information. Ocorrência de espécies. 2015. Available from:
7. WordClim. Global climate data. 2005. Available from:
8. Phillips, S., Anderson, R.P., and Schapire, R. Maximum entropy modeling of species geographic distributions. Ecological Modelling, 2006. 190(231-259).
9. Phillips, S., Dudik, M., and Schapire, R. Maxent Software. 2010. Available from:
10. Steege, H. et al. Hyperdominance in the Amazonian Tree Flora. Science, 2013. 342(6156).

Download report