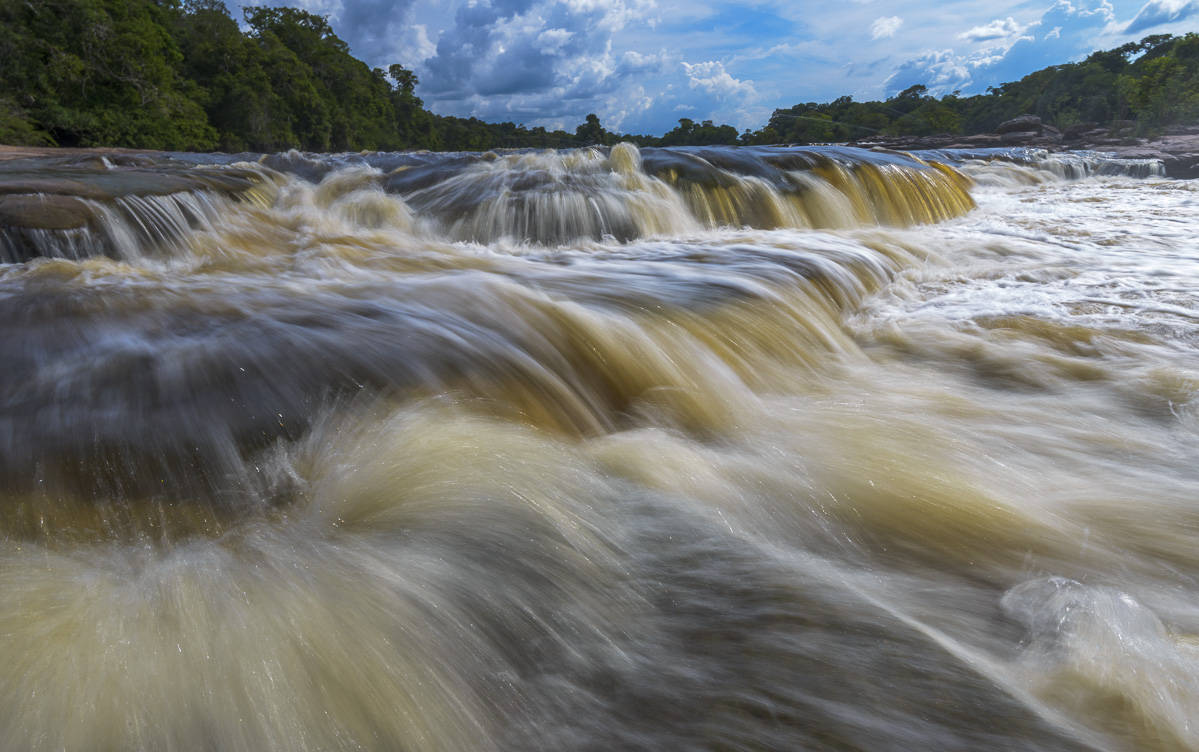
The provision of a wide variety of hydrological services is a key value of the Amazon region’s ecology, as well as a major potential source of impact due to further forest losses and climate change. The hydrology of the Amazon region is globally unique: the average water volume carried by the Amazon River is 6 times that of the second largest river of the world (the Congo). The alteration of hydrological cycle in the Amazon due to deforestation may pose enormous impacts regionally and globally.

Methodology
We mapped the benefits or values of hydrological services from the Amazon rainforest. These include an “origin value map”, that is, a spatial representation of the values stemming from the intrinsic or physical characteristics of individual […]
The Platform “Deforestation and Rainfall” (https://www.biosfera.dea.ufv.br/en-US/deforestation-and-rainfall) was developed to facilitate the visualization of rainfall dynamics in South America due to deforestation scenarios in the Amazon. It allows modeling the rainfall at specific time periods for each deforestation scenario just by selecting the desired options in a simple control box and clicking “Calculate”. The platform requires the minimum resolution of 1024×768 (all iPad models), although 1920×1080 (FullHD) is recommended. To use the platform, you must select four options, which are context dependent. First select the product to be plotted (rain, soy, livestock, or hydroelectric power), and then the deforestation scenario to be evaluated. If the product to be plotted is soy, livestock or electricity, other options should be selected such as total production, production revenue or the value of the climate regulation ecosystem service. Other parameters, such as commodity price, may be requested. After entering all the data, click “Calculate” and the platform will inform the user the map with the changes in climate or production / revenue due to deforestation, totaling the values in the lower bar. For more detailed information, click on “Help” in the platform itself.