Calc Reciprocal Similarity Map
Description
This functor calculates fuzzy similarity indices between maps.
Inputs
| Name | Type | Description |
|---|---|---|
| First Map | Categorical Map Type | A map consisting of classes or categories. |
| Second Map | Categorical Map Type | A map consisting of classes or categories. |
Optional Inputs
| Name | Type | Description | Default Value |
|---|---|---|---|
| Window Size | Positive Integer Value Type | Window size with equal number of lines and columns. Only odd numbers are acceptable. | 5 |
| Use Exponential Decay | Boolean Value Type | If true, the similarity is calculated using an exponential decay function truncated by the window size. Otherwise, a constant function is used within the specified window. | True |
| Cell Type | Cell Type Type | Data cell type. | Signed 8 Bit Integer |
| Null Value | Null Value Type | Null value. | Default |
| Exponential Decay Divisor | Real Value Type | Value used to attenuate the distance in the exponential decay function. This value must be increased when the “Use Exponential Decay” is greater the 11.1) | 2 |
Output
| Name | Type | Description |
|---|---|---|
| First Similarity | Map Type | Map showing the degree of spatial match from the first to the second input map. Similarity varies from zero (no match) to 1 (perfect match) within the specified window size. |
| Second Similarity | Map Type | Map showing the degree of spatial match from the second to the first input map. Similarity varies from zero (no match) to 1 (perfect match) within the specified window size. |
| First Mean | Real Value Type | The mean similarity index for the given window size comparing the first map to the second. |
| Second Mean | Real Value Type | The mean similarity index for the given window size comparing the second map to the first. |
Group
Notes
Spatial models require a comparison within a neighborhood context, because even maps that do not match exactly pixel-by-pixel could still present similar spatial patterns and likewise spatial agreement within a certain pixel vicinity. To address this issue several vicinity-based comparison methods have been developed. For example, Costanza (1989) introduced the multiple resolution fitting procedure that compares a map fit within increasing window sizes. Pontius (2002) presented a method similar to Costanza (1989), but differentiates errors due to location and quantity. Power et al. (2001) provided a comparison method based on hierarchical fuzzy pattern matching. In turn, Hagen (2003) developed new metrics, including the Kfuzzy, considered to be equivalent to the Kappa statistic, and the fuzzy similarity which takes into account the fuzziness of location and category within a cell neighborhood. The method we introduce here is a modification of this latter.
The fuzzy similarity test is based on the concept of fuzziness of location, in which a representation of a cell is influenced by the cell itself and, to a lesser extent, by the cells in its neighborhood (Hagen, 2003). Not considering fuzziness of category, the fuzzy neighborhood vector can represent the fuzziness of location. First a crisp vector is associated to each cell in the map. This vector has as many positions as map categories, assuming 1 for a category = i and 0 for categories other than i. Thus the fuzzy neighborhood vector (Vnbhood) for each cell is determined as follows:
(11) (12)
where mnbhoodi represents the membership for category i within a neighborhood of N cells (usually N = n2); mcrispi,j is the membership of category i for neighboring cell j, assuming, as in a crisp vector, 1 for i and 0 for categories other than i () and mj is the distance based membership of neighboring cell j. m represents a distance decay function, for instance, an exponential decay (m=2-d/A where d is the distance and A is the distance attenuation). Although spatially continuous, to facilitate computation this decay function most often becomes truncated outside of the neighborhood window n x n. Which function is most appropriate and the size of the window depends on the vagueness of the data and the allowed tolerance for spatial error (Hagen, 2003). As we want to assess the model’s spatial fit at various resolutions, in addition to an exponential decay, a constant function equal to 1 inside the neighborhood window and 0 outside of it is also applied. Equation (14) sets the category membership for the central cell, assuming the highest contribution found within a neighborhood window n x n. Next, a similarity measure for a pair of maps can be obtained through a cell-by-cell fuzzy set intersection between their fuzzy and crisp vectors using the following equations:
(13)
where VA and VB represent the fuzzy neighborhood vectors for maps A and B and mA,j and mB,j are their neighborhood memberships for categories in maps A and B, as in equation (13). According to Hagen (2003), since the similarity measure S(VA,VB) tends to overestimate the spatial fit, the two-way similarity is instead applied, so that:
(14)
The overall similarity of a pair of maps can be calculated by averaging the two-way similarity values for all map cells. As random maps tend to score higher, it is recommended picking up the minimum fit value from the two-way comparison.
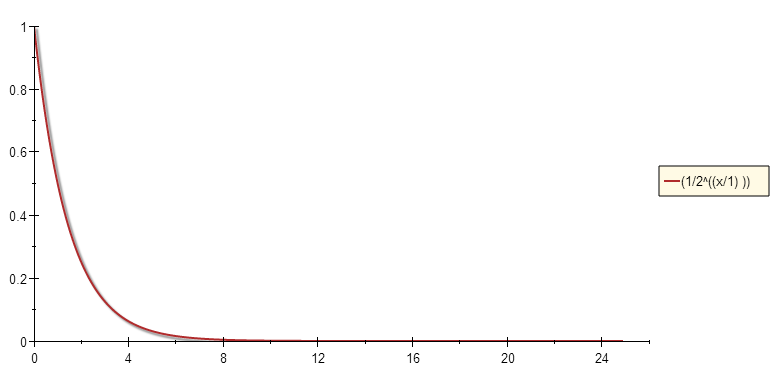
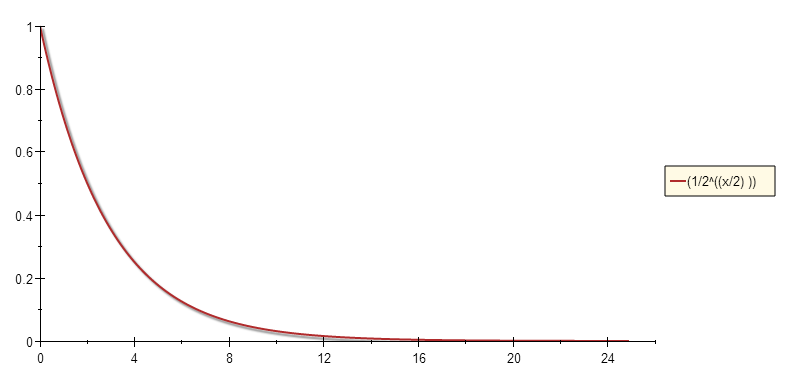
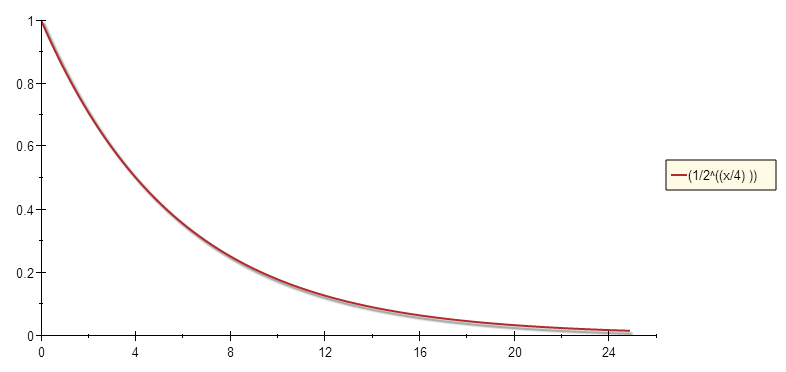
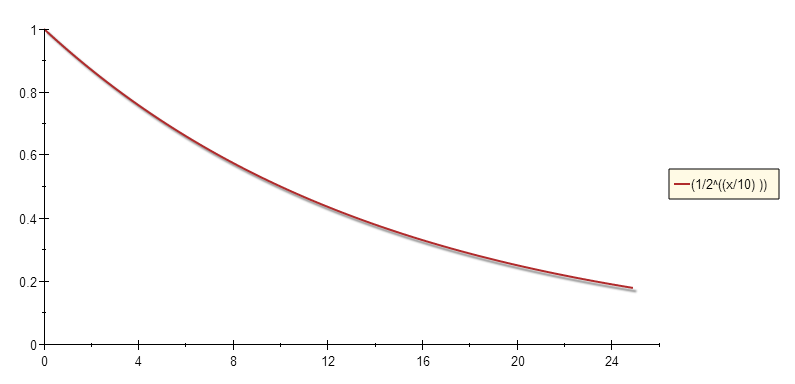
Exponential Decay Function
The exponential decay function used to calculate similarity can be seen below:
where d is the distance from the window center and A is the attenuation factor [Exponential Decay Divisor].
The attenuation parameter can be used to control how fast the exponential function value decreases. The graphs below illustrates:
References
Costanza, R., 1989. Model goodness of fit: a multiple resolution procedure. Ecological Modelling, 47, 199-215.
Goodacre C. M., Bonham-Carter G. F., Agterberg, F. P., Wright D. F., 1993. A statistical analysis of spatial association of seismicity with drainage patterns and magnetic anomalies in western Quebec. Tectonophysics, 217, 205-305.
Hagen, A., 2003. Fuzzy set approach to assessing similarity of categorical maps. International Journal of Geographical Information Science, 17(3), 235–249
Pontius, R.G. Jr., 2002. Statistical Methods to Partition Effects of Quantity and Location During Comparison of Categorical Maps at Multiple Resolutions. Photogrammetric Engineering & Remote Sensing 68(10), 1041-1049.
Power, C., Simms, A., White, R., 2001. Hierarchical fuzzy pattern matching for the regional comparison of Land Use Maps International Journal of Geographical Information Science 15(1), 77-100.
Internal Name
CalcReciprocalSimilarityMap
Usage examples
See practical examples of this functor in Lesson 18: Building a land-use and land-cover change simulation model