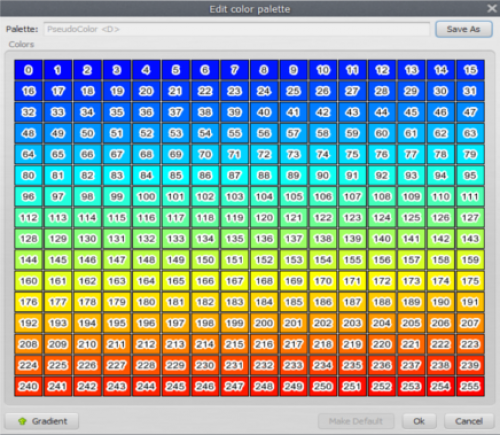
Color Palette
Allow users to select which color represents each cell in visualization area. Cells are first extracted from the map in their original values (in any range) and then re-sampled using the histogram curve. After that, their values fall in the [0, 255] range, which are mapped to palette colors.
Changing colors individually
 Each color can be changed individually, by clicking on its square. You can also check color index value by hovering your cursor over the color square.
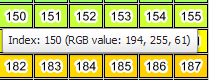
Generated palette
You can also create a palette using a linear interpolation between two color values (gradient). All you have to do is click the gradient button and set your range.
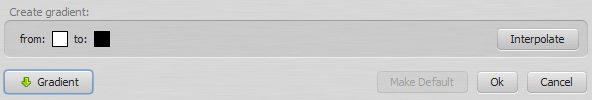
After that, you can click the interpolate button and the new palette view be generated.
Saving your work
Keep in mind that palettes are not saved until the user chooses to do so. If you made any mistake, you can just hit “cancel” and try again. If you hit Ok, the palette will be changed locally, but will reset if you restart the application.
Saved palettes are stored on the disk in the user palette folder Dinamica EGO/Dmps, so every time you reopen the map viewer, you will still have them. Changes made by the user in predefined palettes only affect his own instance of the application. To reset the predefined palettes to their default state, remove the user palette folder and restart the application.
C:\Documents and Settings\<User Name>\My Documents\Dinamica EGO\Dmps, on Windows XP, and C:\Users\<User Name>\Documents\Dinamica EGO\Dmps, on Windows Vista and 7.