In our study, we traced deforestation through the soy and beef supply chains, explicitly linking potentially illegal and legal deforestation on rural properties to their agricultural production and exports from the region to European Union countries. To this end, we have setup a database comprising information on land use, deforestation, soy and beef export data, and the boundaries of 815,000 rural properties.
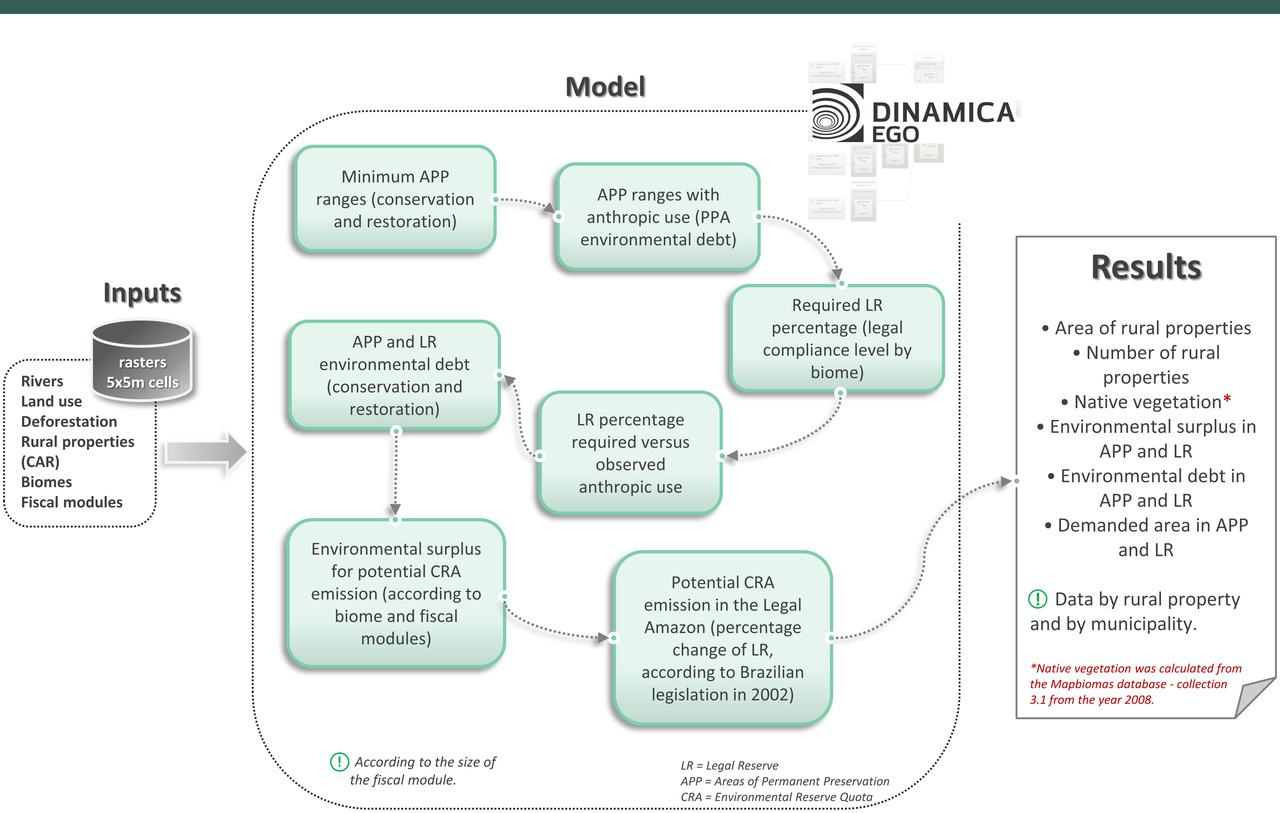
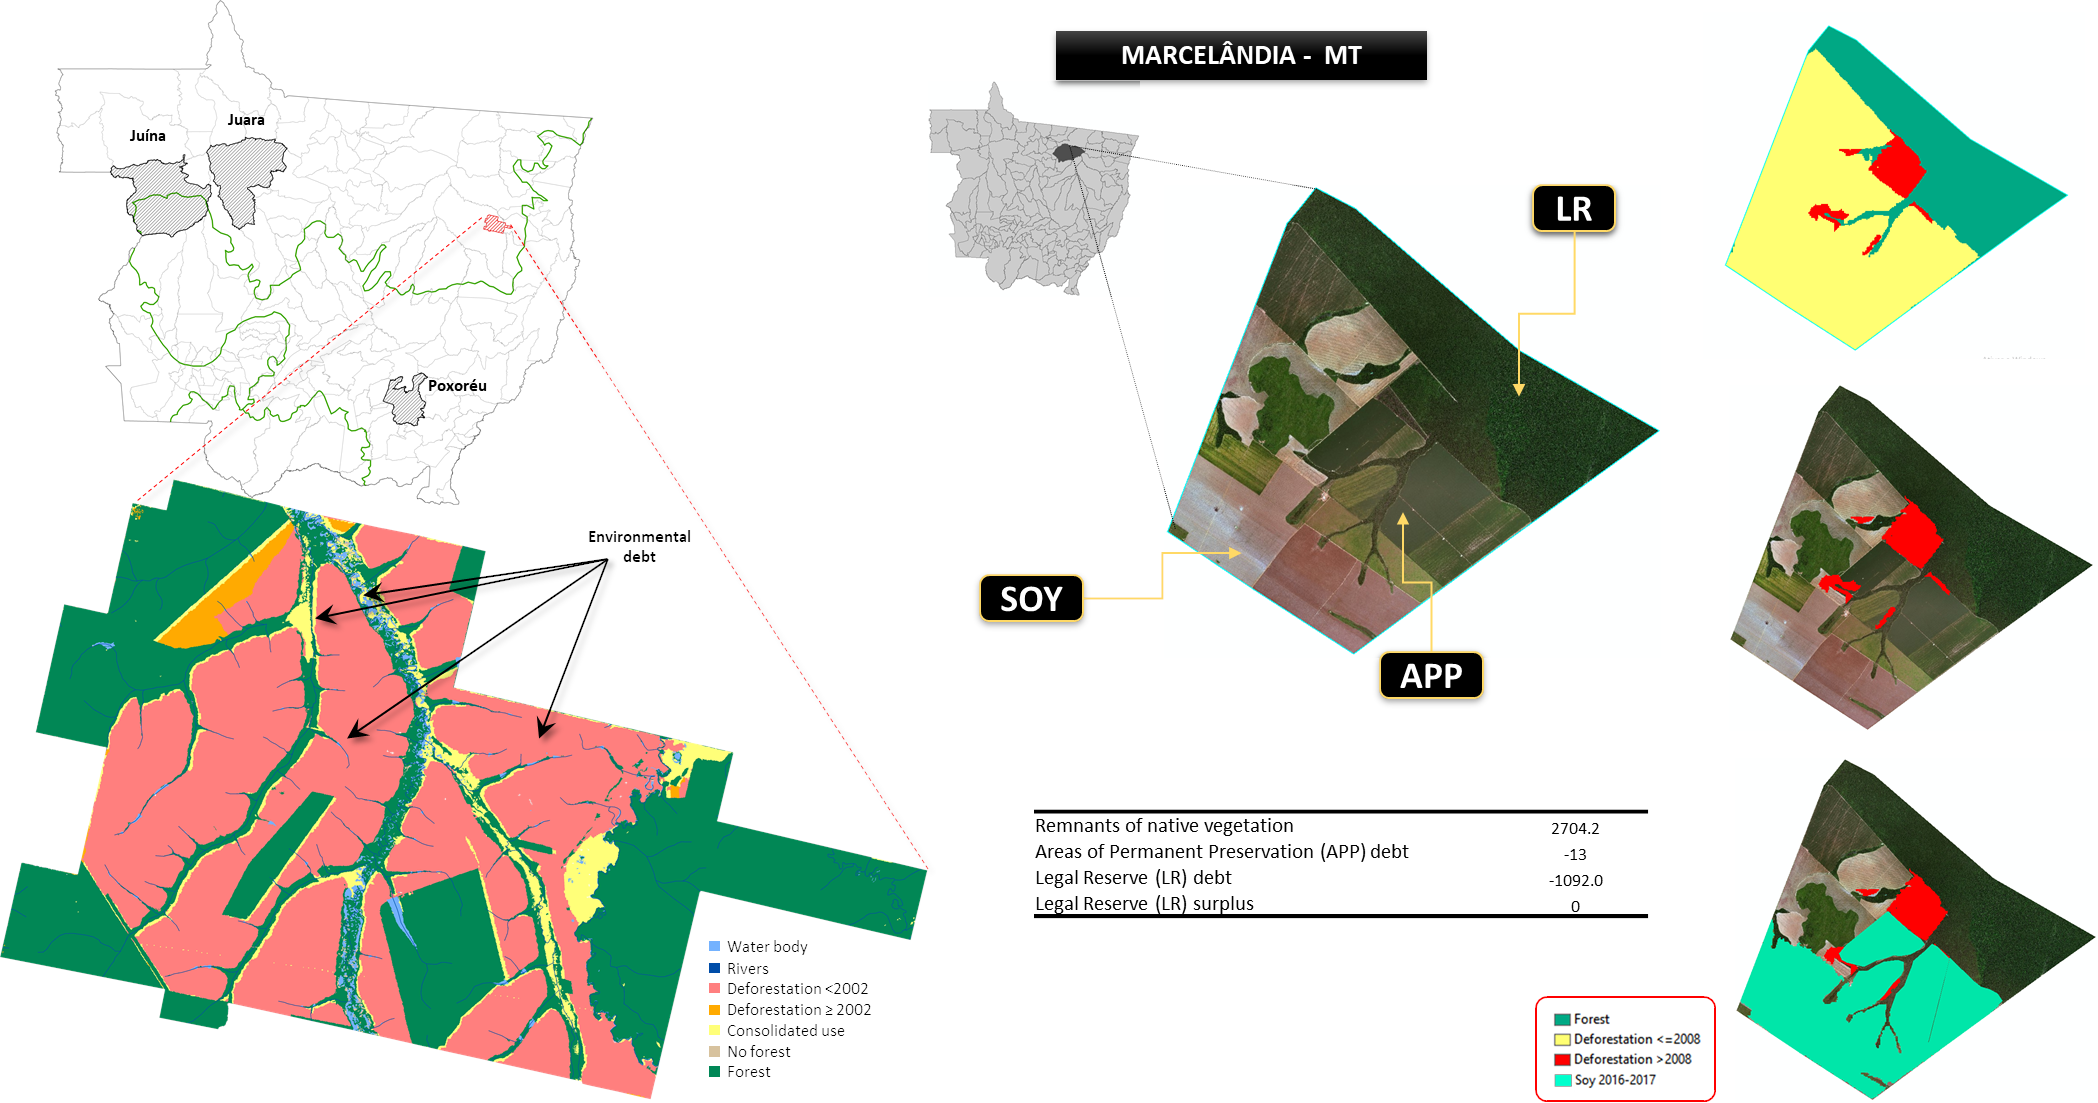
To calculate the FC compliance, including deficit or surplus, the FC model calculates per each property the required amount of Legal Reserve (LR) and Areas of Permanent Protection (APP) and then compare the remaining vegetation cover to assess whether the property is above or below compliance.
The model generates buffers of minimum APP width required for forest conservation or restoration according to the rules of the FC (Brasil 2012, Soares-Filho et al. 2014). The legal reserve (RL) requirement is a share of the property area, varying from 80% in the Amazon biome, 35% in the Cerrado areas in the Legal Amazon and 20% in the other biomes (Art. 12, I). To calculate the RL to be restored, the model also takes into consideration the fiscal modules (MF) and the total area of protected areas by municipality according to the FC. We define a positive result as an environmental surplus and a negative result as an environmental deficit. See figure below.
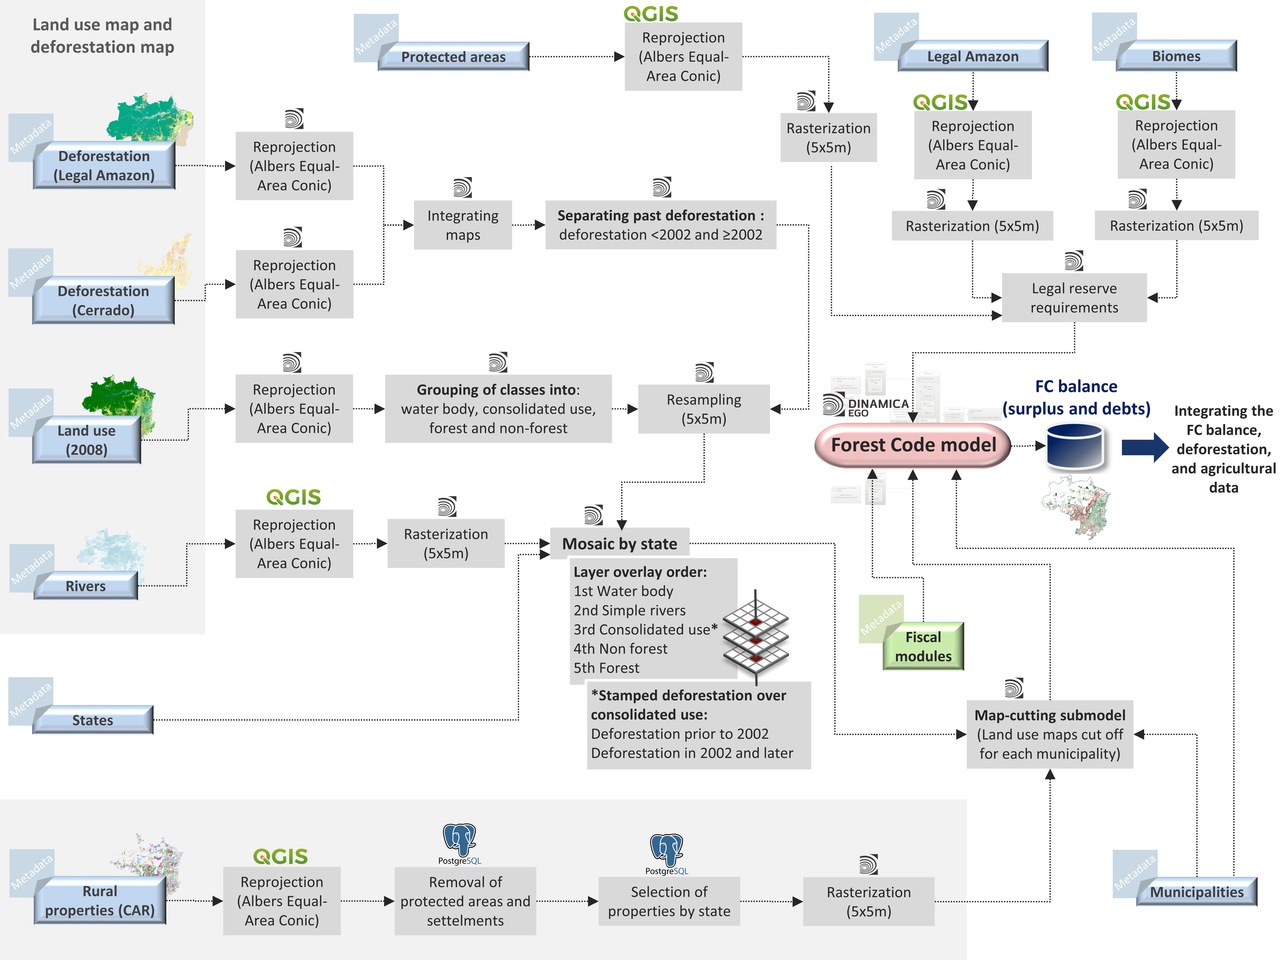
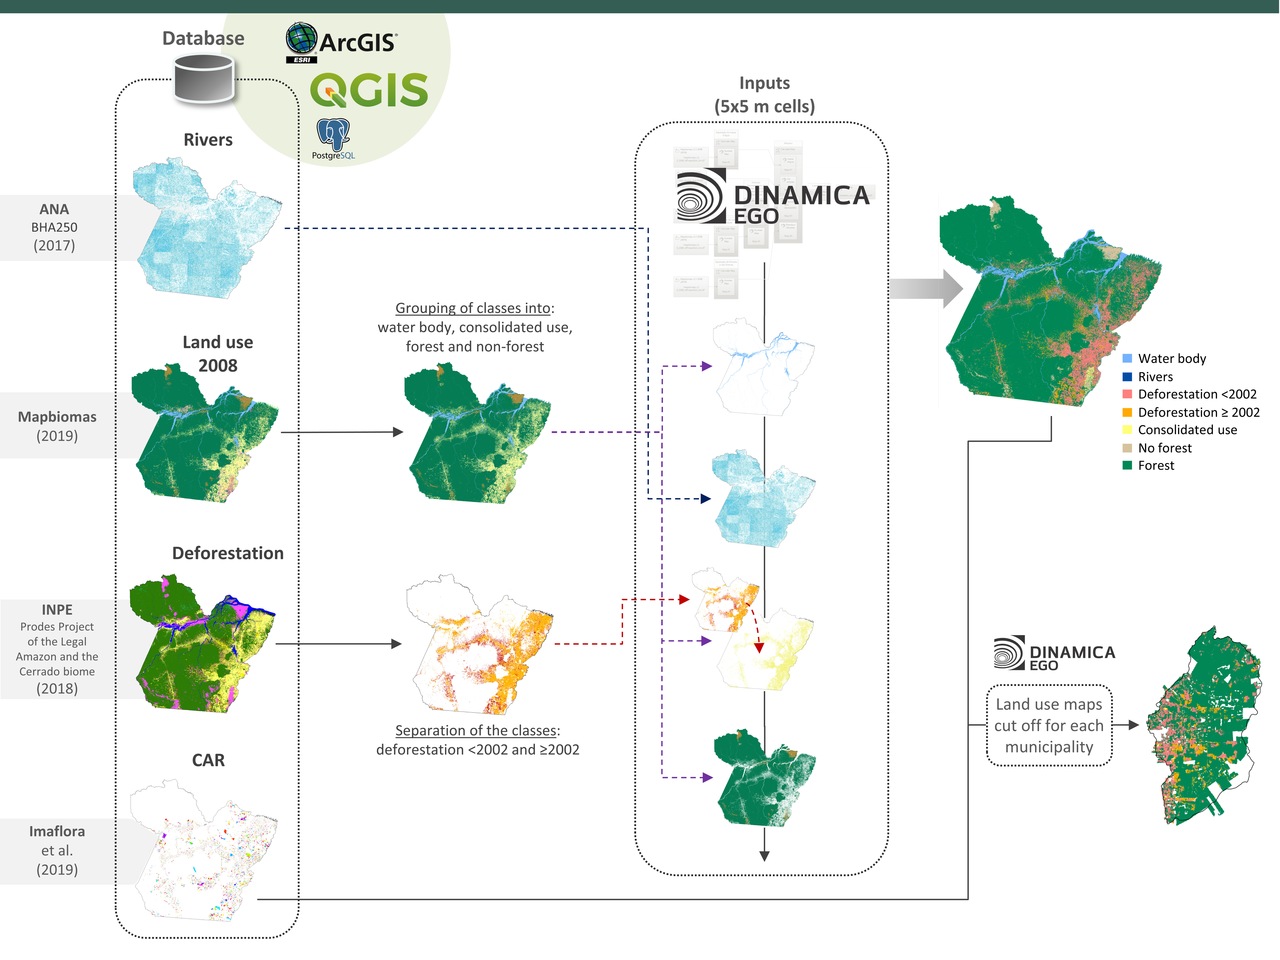
Our model estimates the FC balance using a land-use map that integrates (i) water bodies; (ii) water streams; (iii) agricultural areas, and (iv) native vegetation. Our approach makes use of open-access database.
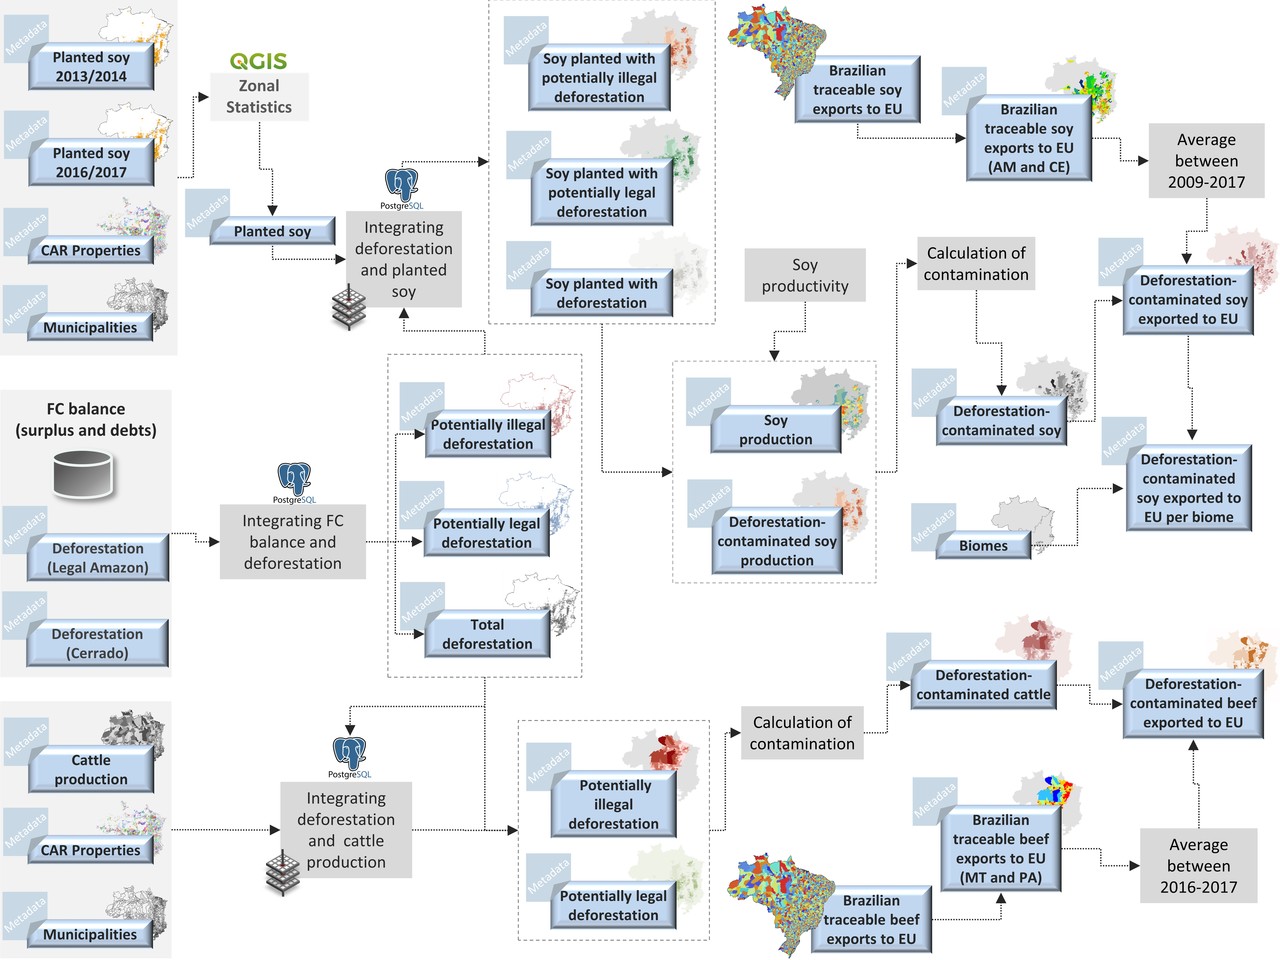
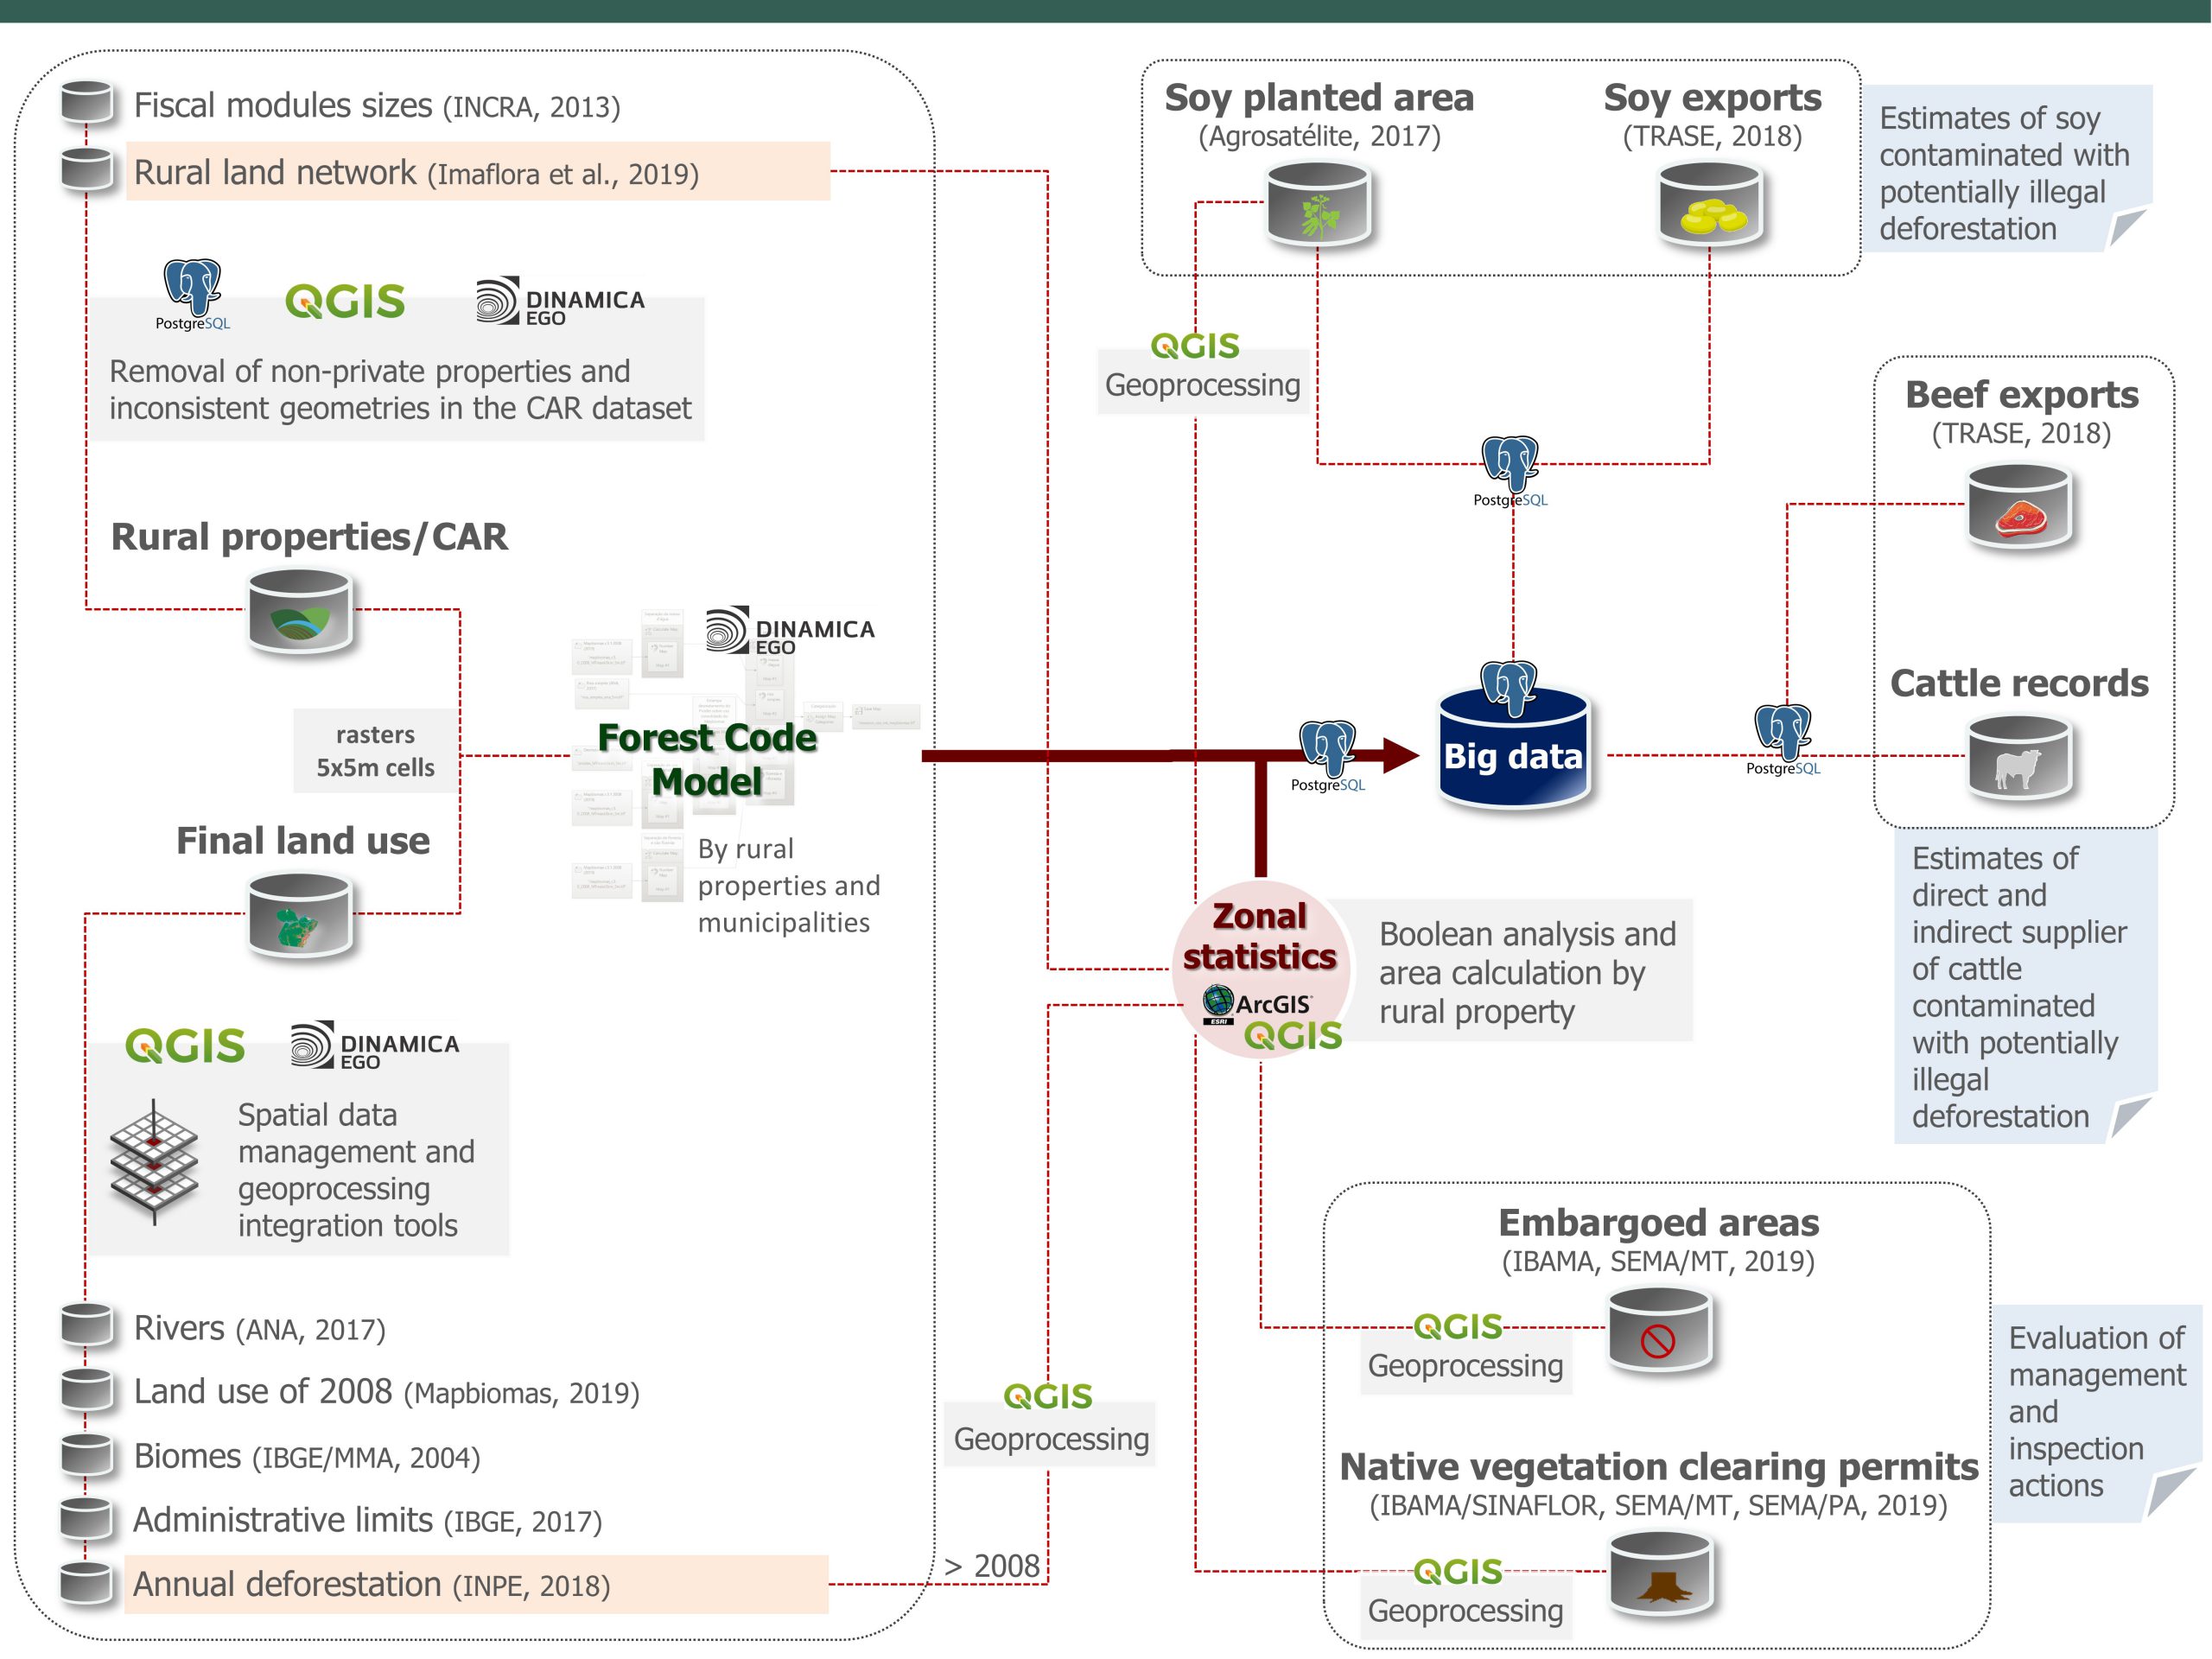
To connect the level of the FC compliance and hence potentially legal and illegal deforestation to the soy and beef supply chains, we have built a spatial database comprising the FC balance per property, deforestation, soy croplands, deforestation permits, embargoes, and permit to transport cattle documents (figure below).
We compared our results with those of the FC models developed by IPAM and IMAFLORA. The intercomparison study aimed to arrive at a common understanding of the law, hence in a common logical model. However, each team developed its own implementation. To this end, the three institutions analyzed selected municipalities in the Amazon and the Cerrado in the state of Mato Grosso using a common database.
For further information access the supplementary material.
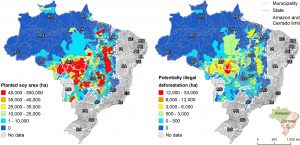
To estimate the amount of soybean contaminated with potentially illegal deforestation, we first identified the percentage of soybean area planted on properties with potentially illegal deforestation in relation to the total soybean planted within the respective municipality, hence the percentage of municipal contamination (figure bellow). We then apply this percentage to the municipal soy export data to the EU (TRASE 2018) to arrive at the total soy exports contaminated with illegal deforestation.
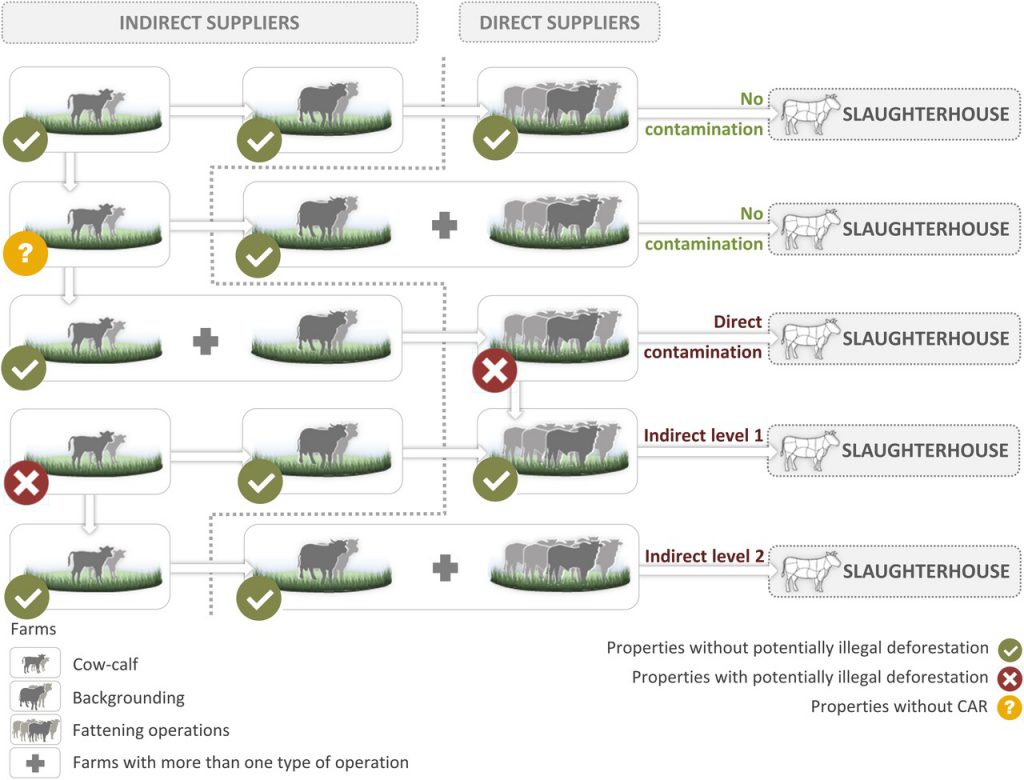
To estimate the number of cattle contaminated with potentially illegal deforestation, we analyzed the cattle records from the states of Pará and Mato Grosso. As a result, we were able trace direct and indirect livestock suppliers, i.e. intermediate cow-calf and rearing operations before cattle are sent to ranches that finish and sell them directly to slaughterhouses. To calculate potentially contaminated beef exports, we estimated for each municipality, the ratio between the total deforestation-contaminated cattle (direct and indirect suppliers) and the total of slaughtered heads. Then, we apply this ratio to the beef equivalent exports from that municipality to the European Union using TRASE data (TRASE 2018).